CA Foundation Economics – Fiscal Policy Multiple Choice Questions

Fiscal Policy Introduction

Question 1. What is Fiscal Policy?

  1. A policy that regulates the flow of foreign exchange in the economy
  2. A policy that controls the circulation of currency notes and coins
  3. A policy that deals with the government’s taxation and spending decisions to influence the economy
  4. A policy that regulates the interest rates in the financial market

Answer: 3. A policy that deals with the government’s taxation and spending decisions to influence the economy

Explanation:

Fiscal Policy refers to the use of government’s taxation and spending decisions to influence the economy’s overall level of economic activity.

Question 2. The main objectives of Fiscal Policy include

  1. Controlling inflation and reducing the fiscal deficit
  2. Regulating the foreign exchange rate and promoting exports
  3. Maintaining price stability and ensuring balanced economic growth
  4. Controlling the money supply and stabilizing the financial market

Answer: 3. Maintaining price stability and ensuring balanced economic growth

Explanation: 

The main objectives of Fiscal Policy include maintaining price stability, controlling inflation, and ensuring balanced economic growth by managing government spending and taxation

Question 3. Fiscal Policy can be classified into two types

  1. Monetary Policy and Exchange Rate Policy
  2. Expansionary Fiscal Policy and Contractionary Fiscal Policy
  3. Microeconomic Policy and Macroeconomic Policy
  4. Trade Policy and Investment Policy

Answer: 2. Expansionary Fiscal Policy and Contractionary Fiscal Policy

Explanation:

Fiscal Policy can be classified into two types: Expansionary Fiscal Policy, which involves increasing government spending and reducing taxes to stimulate economic growth, and Contractionary Fiscal Policy, which involves reducing government spending and increasing taxes to control inflation and cool down the economy.

CA Foundation Economics - Fiscal Policy Multiple Choice Questions

Question 4. When does the government use an Expansionary Fiscal Policy?

  1. During periods of high inflation and overheating in the economy
  2. During periods of recession and high unemployment
  3. During periods of trade deficits and depreciation of the currency
  4. During periods of budget surplus and surplus revenue

Answer: 2. During periods of recession and high unemployment

Explanation:

The government uses an Expansionary Fiscal Policy during periods of recession and high unemployment to stimulate economic growth and increase aggregate demand.

Question 5. What is the primary tool used by the government in implementing Fiscal Policy?

  1. Printing of currency notes and coins
  2. Setting interest rates in the banking sector
  3. Regulation of foreign trade and exports
  4. Government spending and taxation decisions

Answer: 4. Government spending and taxation decisions

Explanation:

Government spending and taxation decisions are the primary tools used by the government in implementing Fiscal Policy to influence the level of economic activity.

Question 6. How does Contractionary Fiscal Policy aim to control inflation?

  1. By reducing the money supply in the economy
  2. By increasing government spending on infrastructure projects
  3. Reducing interest rates to boost investment and consumption
  4. By reducing government spending and increasing taxes

Answer: 1. By reducing government spending and increasing taxes

Explanation:

Contractionary Fiscal Policy aims to control inflation by reducing government spending and increasing taxes, which reduces aggregate demand and helps cool down the economy.

Question 7. Fiscal Policy operates through its impact on

  1. Monetary policy and exchange rates
  2. Interest rates and credit availability
  3. Government administration and bureaucracy
  4. Fiscal deficits and trade imbalances

Answer: 2. Interest rates and credit availability

Explanation:

Fiscal Policy operates through its impact on interest rates and credit availability in the economy, which, in turn, affects consumption and – investment decisions.

Question 8. What are the limitations of Fiscal Policy?

  1. Limited government control over taxation and public spending
  2. The inability to influence the money supply and interest rates
  3. Time lags in the implementation of fiscal measures and their impact
  4. The lack of coordination between fiscal and monetary policies

Answer: 3. Time lags in the implementation of fiscal measures and their impact

Explanation:

One of the limitations of Fiscal Policy is the existence of time lags in the implementation of fiscal measures and their impact on the economy. Fiscal measures may take time to have their desired effect, leading to ‘ ’ challenges in timing the policy response appropriately.

Question 9. Fiscal Policy  is a tool used by governments to

  1. Control inflation
  2. Influence the money supply
  3. Stabilize the economy through taxation and government spending
  4. Regulate interest rates

Answer: 3. Stabilize the economy through taxation and government spending

Question 10. Expansionary fiscal policy involves

  1. Decreasing government spending and increasing taxes
  2. Decreasing government spending and decreasing taxes
  3. Increasing government spending and decreasing taxes
  4. Increasing government spending and increasing taxes

Answer: 3. Increasing government spending and decreasing taxes

Question 11. A contractionary fiscal policy is implemented to

  1. Encourage borrowing and spending
  2. Combat recession and control inflation
  3. Stimulate economic growth
  4. Increase the money supply

Answer: 2. Combat recession and control inflation

Question 12. When the government’s total expenditures exceed its total revenues in a fiscal year, it results in

  1. A budget surplus
  2. A budget deficit
  3. Fiscal equilibrium
  4. An inflationary gap

Answer: 2. A budget deficit

Question 13. Automatic stabilizers in fiscal policy refer to

  1. Automatic adjustments in tax rates and government spending that counter-economic fluctuations
  2. Fixed government spending that remains constant regardless of economic conditions
  3. The government’s ability to stabilize the stock market automatically
  4. The automatic increase in interest rates during a recession

Answer: 1. Automatic adjustments in tax rates and government spending that counter-economic fluctuations

Objectives Of Fiscal Policy

Question 1. What are the primary objectives of Fiscal Policy?

  1. Regulating the money supply and controlling inflation
  2. Promoting exports and reducing trade deficits
  3. Managing government spending and reducing the fiscal deficit
  4. Maintaining price stability and ensuring balanced economic growth

Answer: 4. Maintaining price stability and ensuring balanced economic growth

Explanation:

The primary objectives of Fiscal Policy are to maintain price stability, control inflation, and ensure balanced economic growth by managing government spending and taxation.

Question 2. How does Fiscal Policy contribute to economic stability?

  1. By directly controlling interest rates and money supply
  2. By influencing the level of aggregate demand and economic activity
  3. By regulating foreign exchange rates and trade balances
  4. By promoting savings and investments in the economy

Answer: 2. By influencing the level of aggregate demand and economic activity

Explanation:

Fiscal Policy contributes to economic stability by influencing the level of aggregate demand and economic activity through government spending and taxation decisions.

Question 3. During periods of recession and high unemployment, Fiscal Policy aims to

  1. Increase government spending and reduce taxes
  2. Reduce government spending and increase taxes
  3. Control inflation and cool down the economy
  4. Reduce interest rates and boost private investment

Answer: 1. Increase government spending and reduce taxes

Explanation:

During periods of recession and high unemployment, Fiscal Policy aims to stimulate economic growth and increase aggregate demand by increasing government spending and reducing taxes. This is known as an Expansionary Fiscal Policy.

Question 4. How does Fiscal Policy help in controlling inflation?

  1. By directly controlling interest rates and money supply
  2. By reducing government spending and increasing taxes
  3. By promoting exports and reducing trade deficits
  4. Encouraging private investment through tax incentives

Answer: 2. By reducing government spending and increasing taxes

Explanation:

Fiscal Policy helps in controlling inflation by reducing aggregate demand in the economy. This is achieved through a Contractionary Fiscal Policy, which involves reducing government spending and increasing taxes.

Question 5. What is the relationship between Fiscal Policy and economic growth?

  1. Fiscal Policy has no impact on economic growth.
  2. Expansionary Fiscal Policy leads to economic growth.
  3. Contractionary Fiscal Policy leads to economic growth.
  4. Fiscal Policy only affects the distribution of income.

Answer: 2. Expansionary Fiscal Policy leads to economic growth. Explanation:

Expansionary Fiscal Policy, which involves increasing government spending and. reducing taxes, leads to an increase in aggregate demand and stimulates economic growth.

Question 6. Fiscal Policy can be used to address which of the following economic challenges? 

  1. Political instability and corruption
  2. Technological advancements and automation
  3. Income inequality and poverty
  4. Exchange rate fluctuations and balance of payments

Answer: 3. Income inequality and poverty

Explanation:

Fiscal Policy can be used to address income inequality and poverty by implementing progressive taxation and directing government spending toward social welfare programs.

Question 7. How does Fiscal Policy influence private sector investment?

  1. By directly controlling interest rates in the financial market
  2. Providing subsidies and incentives to private companies
  3. Regulating foreign direct investment (FDI) and trade policies
  4. By altering the overall level of economic activity and confidence in the economy

Answer: 4. By altering the overall level of economic activity and confidence in the economy

Explanation:

Fiscal Policy influences private sector investment by altering the overall level of economic activity and creating a favorable business environment, which affects business confidence and investment decisions.

Question 8. What is the major challenge in implementing Fiscal Policy effectively?

  1. Coordinating fiscal measures with monetary policy
  2. Limitations in government control over taxation and public spending
  3. Uncertainties in the global economic environment
  4. Lack of skilled labor and technological advancements

Answer: 1. Coordinating fiscal measures with monetary policy

Explanation:

A major challenge in implementing Fiscal Policy effectively is coordinating fiscal measures with monetary policy to ensure that both policies work coherently and support the overall economic objectives.

Question 9. The primary objective of fiscal policy is to

  1. Control inflation
  2. Stabilize the exchange rate
  3. Maximize government revenue
  4. Promote economic stability and growth

Answer: 4. Promote economic stability and growth

Question 10. Fiscal policy can be used to reduce unemployment by.

  1. Decreasing government spending and increasing taxes
  2. Decreasing government spending and decreasing taxes
  3. Increasing government spending and decreasing taxes
  4. Increasing government spending and increasing taxes

Answer: 3. Increasing government spending and decreasing taxes

Question 11. To control inflation, the government can use

  1. Expansionary fiscal policy
  2. Contractionary fiscal policy
  3. Neutral fiscal policy
  4. Fiscal austerity measures

Answer: 2. Contractionary fiscal policy

Question 12. When the government aims to achieve a balanced budget, it means

  1. Government spending is equal to government revenue
  2. Government spending exceeds government revenue
  3. Government revenue exceeds government spending
  4. Government spending is minimized to zero

Answer: 1. Government spending is equal to government revenue

Question 13. One of the social objectives of fiscal policy is to

  1. Encourage foreign investment
  2. Promote exports
  3. Reduce income inequality
  4. Increase interest rates

Answer: 3. Reduce income inequality

Types Of Fiscal Policy

Question 1. What are the two main types of Fiscal Policy?

  1. Monetary Fiscal Policy and Exchange Rate Fiscal Policy
  2. Expansionary Fiscal Policy and Contractionary Fiscal Policy
  3. Micro Fiscal Policy and Macro Fiscal Policy
  4. Trade Fiscal Policy and Investment Fiscal Policy

Answer: 2. Expansionary Fiscal Policy and Contractionary Fiscal Policy

Explanation:

The two main types of Fiscal Policy are Expansionary Fiscal Policy and Contractionary Fiscal Policy. The former aims to stimulate economic growth, while the latter aims to control inflation.

Question 2. What is the objective of an Expansionary Fiscal Policy?

  1. To control inflation and reduce aggregate demand
  2. To reduce government spending and increase taxes
  3. To stimulate economic growth and increase aggregate demand
  4. To promote exports and reduce trade deficits

Answer: 3. To stimulate economic growth and increase aggregate demand

Explanation:

The objective of an Expansionary Fiscal Policy is to stimulate economic growth and increase aggregate demand in the economy by increasing government spending and reducing taxes.

Question 3. How does Contractionary Fiscal Policy impact the economy?

  1. It leads to higher economic growth and reduced unemployment.
  2. It stimulates private investment and increases consumer spending.
  3. It reduces aggregate demand and controls inflation.
  4. It promotes exports and improves the balance of payments.

Answer: 3. It reduces aggregate demand and controls inflation. ,

Explanation:

Contractionary Fiscal Policy reduces aggregate demand in the economy by reducing government spending and increasing taxes. It is used to control inflation and prevent the economy from overheating.

Question 4. During an economic recession, which type of Fiscal Policy would be most appropriate?

  1. Expansionary Fiscal Policy
  2. Contractionary Fiscal Policy
  3. Monetary Fiscal Policy
  4. Exchange Rate Fiscal Policy

Answer: 1. Expansionary Fiscal Policy

Explanation:

During an economic recession, when there is low economic growth and high unemployment, an Expansionary Fiscal Policy is most appropriate to stimulate economic activity and increase aggregate demand.

Question 5. How does the government implement an Expansionary Fiscal Policy?

  1. By reducing government spending and increasing taxes
  2. By reducing interest rates and controlling the money supply
  3. By increasing government spending and reducing taxes
  4. By regulating foreign exchange rates and trade balances

Answer: 3. By increasing government spending and reducing taxes

Explanation:

To implement an Expansionary Fiscal Policy, the government increases government spending on infrastructure projects and social welfare programs, and it reduces taxes to boost disposable income and consumer spending.

Question 6. What is the goal of a Contractionary Fiscal Policy?

  1. To promote exports and improve the balance of trade
  2. To increase government spending and stimulate economic growth
  3. To reduce government revenue and increase the budget deficit
  4. To control inflation and reduce aggregate demand

Answer: 4. To control inflation and reduce aggregate demand

Explanation:

The goal of a Contractionary Fiscal Policy is to control inflation and reduce aggregate demand in the economy by reducing government spending and increasing taxes.

Question 7. What are the main instruments used in implementing Fiscal Policy?

  1. Regulation of foreign exchange rates and monetary policies
  2. Control over the money supply and interest rates
  3. Government spending and taxation decisions
  4. Trade policies and export incentives

Answer: 3. Government spending and taxation decisions

Explanation:

The main instruments used in implementing Fiscal Policy are government spending and taxation decisions, which directly influence aggregate demand and economic activity.

Question 8. In a period of high inflation and excessive economic growth, which type of Fiscal Policy is appropriate?

  1. Expansionary Fiscal Policy
  2. Contractionary Fiscal Policy
  3. Monetary Fiscal Policy
  4. Exchange Rate Fiscal Policy

Answer: 2. Contractionary Fiscal Policy

Explanation:

In a period of high inflation and excessive economic growth, a Contractionary Fiscal Policy is appropriate to control inflation and reduce aggregate demand in the economy.

Question 9. Which type of fiscal policy is used during periods of economic downturn, or recession to stimulate economic growth?

  1. Expansionary fiscal policy
  2. Contractionary fiscal policy
  3. Neutral fiscal policy
  4. Austerity fiscal policy

Answer: 3. Neutral fiscal policy

Question 10. When the government aims to decrease aggregate demand and control inflation, it adopts

  1. Expansionary fiscal policy
  2. Contractionary fiscal policy
  3. Neutral fiscal policy
  4. Regressive fiscal policy

Answer: 2. Contractionary fiscal policy

Question 11. Fiscal policy that aims to keep the economy at a stable growth rate without significant fluctuations is called

  1. Expansionary fiscal policy
  2. Contractionary fiscal policy
  3. Neutral fiscal policy
  4. Counter-cyclical fiscal policy

Answer: 3. Neutral fiscal policy

Question 12. A government reducing public spending and increasing taxes to address a high budget deficit and reduce inflation is an example of

  1. Expansionary fiscal policy
  2. Contractionary fiscal policy
  3. Neutral fiscal policy
  4. Discretionary fiscal policy

Answer: 2. Contractionary fiscal policy

Question 13. Automatic stabilizers are considered a part of which type of fiscal policy?

  1. Expansionary fiscal policy
  2. Contractionary fiscal policy
  3. Automatic fiscal policy
  4. Discretionary fiscal policy

Answer: 3. Automatic fiscal policy

The Instruments Of Fiscal Policy

Question 1. Which of the following is an instrument of Fiscal Policy used to stimulate economic growth and increase aggregate demand?

  1. Monetary Policy
  2. Contractionary Fiscal Policy
  3. Exchange Rate Policy
  4. Expansionary Fiscal Policy

Answer: 2. Expansionary Fiscal Policy

Explanation:

Expansionary Fiscal Policy is an instrument of Fiscal Policy used to stimulate economic growth and increase aggregate demand by increasing government spending and reducing taxes. ,

Question 2. How does the government use taxation as an instrument of Fiscal Policy?

  1. Imposing tariffs on imports to promote domestic industries
  2. By controlling the money supply and interest rates
  3. Regulating the exchange rate to boost exports
  4. Adjusting tax rates to influence disposable income and consumption

Answer: 4. By adjusting tax rates to influence disposable income and consumption

Explanation:

The government uses taxation as an instrument of Fiscal Policy by adjusting tax rates to influence disposable income and consumption, which in turn affects aggregate demand. .

Question 3. During periods of high inflation, which instrument of Fiscal Policy is most likely to be used?

  1. Monetary Policy
  2. Expansionary Fiscal Policy
  3. Exchange Rate Policy
  4. Contractionary Fiscal Policy

Answer: 4. Contractionary Fiscal Policy

Explanation:

During periods of high inflation, the government is likely to use Contractionary Fiscal Policy to control inflation by reducing government spending and increasing taxes.

Question 4. What is the primary objective of using government spending as an instrument of Fiscal Policy?

  1. To regulate the money supply and control interest rates
  2. To increase tax revenue and reduce budget deficit
  3. To stimulate economic growth and create demand for goods and services
  4. To promote exports and improve the balance of trade

Answer: 3. To stimulate economic growth and create demand for goods and services

Explanation:

The primary objective of using government spending as an instrument of Fiscal Policy is to stimulate economic growth and create demand for goods and sen/ices, thereby increasing aggregate demand.

Question 5. How does the government use public investment as an instrument of Fiscal Policy?

  1. Investing in foreign markets to promote international trade
  2. By providing subsidies to private companies for investments
  3. Investing in infrastructure projects to boost economic activity
  4. By controlling the foreign exchange rate and capita! flows

Answer: 3. By investing in infrastructure projects to boost economic activity

Explanation:

The government uses public investment as an instrument of Fiscal Policy by investing in infrastructure projects, such as roads, bridges, and public utilities, to boost economic activity and create jobs.

Question 6. Which of the following is an automatic stabilizer used in Fiscal Policy?

  1. Public debt management
  2. Progressive taxation
  3. Exchange rate intervention
  4. Controlling inflation expectations

Answer: 2. Progressive taxation

Explanation:

Progressive taxation is an automatic stabilizer used in Fiscal Policy, as it helps stabilize the economy by reducing income inequality during economic downturns.

Question 7. How does Fiscal Policy complement monetary policy?

  1. By controlling foreign exchange rates and capital flows
  2. By regulating the money supply and interest rates
  3. By promoting exports and reducing trade deficits
  4. By influencing government spending and taxation decisions

Answer: 4. By influencing government spending and taxation decisions

Explanation:

Fiscal Policy complements monetary policy by influencing government spending and taxation decisions to achieve.the desired economic ‘ objectives, such as stimulating economic growth or controlling inflation.

Question 8. When the government increases public expenditure on education and healthcare, it is using Fiscal Policy as an instrument to:

  1. Regulate the money supply and control inflation
  2. Promote international trade and exports
  3. Enhance human capital and promote long-term economic growth
  4. Stabilize the financial market and control exchange rates

Answer: 3. Enhance human capital and promote long-term economic growth

Explanation:

When the government increases public expenditure on education and * healthcare, it is using Fiscal Policy as an instrument to enhance human capital and promote long-term economic growth by investing in the development of its workforce.

Question 9. Which fiscal policy instrument involves the government’s ability to control the total amount of money in circulation and the interest rates?

  1. Government spending
  2. Taxation
  3. Public debt
  4. Monetary policy

Answer: 2. Taxation

Question 10. How does the government use fiscal policy to implement expansionary measures during a recession?

  1. Decreasing government spending and increasing taxes
  2. Increasing government spending and increasing taxes
  3. Increasing government spending and decreasing taxes
  4. Decreasing government spending and decreasing taxes

Answer: 3. Increasing government spending and decreasing taxes

Question 11. When the government aims to reduce inflation and control economic growth, it can use which fiscal policy instrument?

  1. Decreasing government spending
  2. Increasing government spending
  3. Increasing taxes
  4. Decreasing taxes

Answer: 3. Increasing taxes

Question 12. Which fiscal policy instrument can be used to finance government spending and bridge budget deficits?

  1. Government subsidies
  2. Public debt
  3. Automatic stabilizers
  4. Fiscal multipliers

Answer: 2. Public debt

Question 13. Fiscal policy can be employed to achieve income redistribution by

  1. Increasing corporate taxes
  2. Implementing progressive income taxes
  3. Decreasing sales taxes
  4. Providing subsidies to businesses

Answer: 2. Implementing progressive income taxes

 Government Expenditure As An Instrument Of Fiscal Policy

Question 1. How does the government use government expenditure as an instrument of Fiscal Policy?

  1. By regulating foreign exchange rates and trade balances
  2. By controlling the money supply and interest rates
  3. By adjusting tax rates to influence consumption
  4. By increasing or decreasing spending on goods and services

Answer: 4. By increasing or decreasing spending on goods and services

Explanation:

The government uses government expenditure as an instrument of Fiscal Policy by increasing or decreasing its spending on goods and services to influence aggregate demand and stimulate economic growth or control inflation.

Question 2. During a period of economic recession, what is the likely approach of the government regarding government expenditure?

  1. Increase government expenditure to stimulate economic growth
  2. Maintain government expenditure at the current level
  3. Reduce government expenditure to control inflation
  4. Shift government expenditure towards defense and security

Answer: 1. Increase government expenditure to stimulate economic growth

Explanation:

During a period of economic recession, the government is likely to increase government expenditure on infrastructure projects and social welfare programs to stimulate economic growth and increase aggregate demand.

Question 3. How does an increase in government expenditure impact the economy?

  1. It reduces aggregate demand and leads to deflation.
  2. It stimulates economic growth and increases employment.
  3. It increases trade deficits and the depreciation of the currency.
  4. It leads to a budget surplus and reduces public debt.

Answer: 2. It stimulates economic growth and increases employment. Explanation:

An increase in government expenditure stimulates economic growth by increasing demand for goods and services, which leads to increased production and employment in the economy.

Question 4. During a period of high inflation, what is the likely approach of the government regarding government expenditure?

  1. Increase government expenditure to boost economic growth
  2. Maintain government expenditure at the current level
  3. Reduce government expenditure to control inflation
  4. Shift government expenditure towards social welfare programs

Answer: 3. Reduce government expenditure to control inflation

Explanation:

During a period of high inflation, the government is likely to reduce government expenditure to control inflation and reduce aggregate demand in the economy.

Question 5. Which sector of the economy is typically targeted by the government for increased expenditure during an economic recession?

  1. Defense and security sector
  2. Financial and banking sector
  3. Export-oriented industries
  4. Infrastructure and social welfare sector.

Answer: 4. Infrastructure and social welfare sector

Explanation:

During an economic recession, the government typically targets increased expenditure on infrastructure and social welfare programs to stimulate economic growth and create jobs.

Question 6. How does government expenditure influence private investment?

  1. By directly controlling interest rates in the financial market
  2. Providing subsidies and incentives to private companies
  3. Regulating foreign direct investment (FDI) and trade policies
  4. By creating a conducive business environment and increasing demand for goods and services

Answer: 4. By creating a conducive business environment and increasing demand for goods and services

Explanation:

Government expenditure influences private investment by creating a conducive business environment through infrastructure development and increasing demand for goods and services, which can boost private sector confidence and investment.

Question 7. Which of the following is a key consideration for the government while determining the allocation of government expenditure?

  1. Increasing trade deficits and promoting exports
  2. Balancing the budget and reducing fiscal deficits
  3. Regulating foreign exchange rates and capital flows
  4. Addressing the needs of various sectors and promoting economic development

Answer: 4. Addressing the needs of various sectors and promoting economic development Explanation:

A key consideration for the government while determining the allocation of government expenditure is to address the needs of various sectors in the economy and promote overall economic development.

Question 8. What is the impact of an increase in government expenditure on fiscal deficit?

  1. It reduces the fiscal deficit due to increased tax revenue.
  2. It has no impact on the fiscal deficit as long as tax rates remain constant.
  3. It increases the fiscal deficit, especially if tax revenue does not increase proportionately.
  4. It stabilizes the fiscal deficit by controlling public debt.

Answer: 3. It increases the fiscal deficit, especially if tax revenue does not increase proportionately.

Explanation:

An increase in government expenditure can lead to an increase in the fiscal deficit, especially if tax revenue does not increase proportionately to cover the additional spending.

 Taxes As An Instrument Of Fiscal Policy

Question 1. How does the government use taxes as an instrument of Fiscal Policy?

  1. Adjusting government expenditure to influence aggregate demand
  2. By controlling the money supply and interest rates
  3. By increasing or decreasing tax rates to influence disposable income and consumption
  4. By regulating foreign exchange rates and trade balances

Answer: 3. By increasing or decreasing tax rates to influence disposable income and consumption

Explanation:

The government uses taxes as an instrument of Fiscal Policy by adjusting tax rates to influence disposable income and consumption, which in turn affects aggregate demand.

Question 2. During a period of high inflation, what is the likely approach of the government regarding taxes?

  1. Increase tax rates to reduce disposable income and control inflation
  2. Reduce tax rates to stimulate consumer spending and boost economic growth
  3. Maintain tax rates at the current level and focus on other policy measures
  4. Shift the tax burden towards corporate taxes and away from individual taxes

Answer: 1. Increase tax rates to reduce disposable income and control inflation

Explanation:

During a period of high inflation, the government is likely to increase tax rates to reduce disposable income, decrease consumer spending, and control inflation.

Question 3. How does a decrease in tax rates impact the economy?

  1. It reduces government revenue and increases the budget deficit.
  2. It stimulates economic growth and increases private investment.
  3. It increases trade deficits and the depreciation of the currency.
  4. It leads to a surplus in the balance of trade and reduces public debt.

Answer: 2. It stimulates economic growth and increases private investment.

Explanation:

A decrease in tax rates stimulates economic growth by increasing disposable income and consumer spending, which can lead to increased private investment and overall economic activity.

Question 4. During a period of economic recession, what is the likely approach of the government regarding taxes?

  1. Increase tax rates to boost government revenue and reduce fiscal deficit
  2. Reduce tax rates to stimulate consumer spending and increase aggregate demand
  3. Maintain tax rates at the current level and focus on other policy measures
  4. Shift the tax burden towards individual taxes and away from corporate taxes

Answer: 2. Reduce tax rates to stimulate consumer spending and increase aggregate demand

Explanation:

During a period of economic recession, the government is likely to reduce tax rates to increase disposable income, boost consumer spending, and stimulate aggregate demand.

Question 5. Which type of tax policy is more suitable during periods of economic? expansion and growth?

  1. Progressive tax policy with higher tax rates for higher income groups
  2. Regressive tax policy with higher tax rates for lower-income groups
  3. Proportional tax policy with a flat tax rate for all income groups
  4. Neutral tax policy with no changes in tax rates during economic cycles

Answer: 1. Progressive tax policy with higher tax rates for higher income groups

Explanation:

During periods of economic expansion and growth, a progressive tax policy with higher tax rates for higher income groups is more suitable as it helps reduce income inequality and generates higher revenue during economic prosperity.

Question 6. How does the government use tax incentives as a tool of Fiscal Policy?

  1. By reducing tax rates for essential goods and services
  2. By providing subsidies to corporations for capital investments
  3. By offering tax deductions and exemptions to encourage specific behaviors
  4. Imposing higher taxes on luxury goods and services

Answer: 3. By offering tax deductions and exemptions to encourage specific behaviors.

Explanation:

The government uses tax incentives as a tool of Fiscal Policy by offering tax deductions and exemptions to encourage specific behaviors, such as investment in certain industries or saving for retirement.

Question 7. What is the impact of an increase in taxes on consumer spending?

  1. It leads to an increase in consumer spending due to higher disposable income.
  2. It leads to a decrease in consumer spending due to reduced disposable income.
  3. It has no impact on consumer spending as long as interest rates remain constant.
  4. It leads to a shift in consumer spending towards non-taxable goods and services.

Answer: 2. It leads to a decrease in consumer spending due to reduced disposable income. ‘ .

Explanation:

An increase in taxes reduces disposable income, which in turn leads to a decrease in consumer spending as people have less money available for spending on goods and services.

Question 8. How does the government use tax policy to address income inequality?

  1. Providing tax deductions only to high-income groups
  2. By reducing tax rates for all income groups equally
  3. Imposing higher taxes on low-income individuals
  4. By implementing progressive tax rates with higher rates for higher income groups

Answer: 4. By implementing progressive tax rates with higher rates for higher income groups

Explanation:

The government uses tax policy to address income inequality by implementing progressive tax rates, where higher-income individuals are subject to higher tax rates, thereby reducing income disparity.

Public Debt As An Instrument Of Fiscal Policy

Question 1. How does the government use public debt as an instrument of Fiscal policy?

  1. Borrowing money from foreign governments to finance infrastructure projects
  2. By repaying loans and reducing the fiscal deficit
  3. By issuing government bonds to finance expenditures and stimulate economic growth
  4. By using credit rating agencies to assess the government’s financial position
  5. Answer: 3. By issuing government bonds to finance expenditures and stimulate economic growth

Explanation:

The government uses public debt as an instrument of fiscal Policy by issuing government bonds to finance expenditures, such as infrastructure projects and social welfare programs, which can stimulate economic growth.

Question 2. What is the impact of increased public debt on the economy?

  1. It leads to lower interest rates and increased private investment.
  2. It reduces government expenditure and increases budget surplus.
  3. It may lead to higher interest rates and crowd out private investment.
  4. It has no impact on the economy as public debt is just an accounting entry.

Answer: 3. It may lead to higher interest rates and crowd out private investment

Explanation:

Increased public debt may lead to higher interest rates, as the government competes with private borrowers for funds, which can crowd out private investment and affect overall economic growth.

Question 3. During an economic recession, how does the government use public debt as an instrument of Fiscal Policy?

  1. Reducing public debt through fiscal consolidation measures
  2. By borrowing from international organizations to stimulate economic growth.
  3. By issuing government bonds to finance stimulus packages and increase government spending
  4. By using credit rating agencies to assess the impact of public debt on the economy.

Answer: 3. By issuing government bonds to finance stimulus packages and increase government spending

Explanation:

During an economic recession, the government may use public debt as an instrument of Fiscal Policy by issuing government bonds to finance stimulus packages and increase government spending, which can help stimulate economic growth.

Question 4. What is the primary purpose of issuing government bonds?

  1. To control foreign exchange rates and stabilize the currency
  2. To provide subsidies to private companies for capital investments
  3. To finance government expenditures and infrastructure projects
  4. To reduce the fiscal deficit and increase the budget surplus

Answer: 3. To finance government expenditures and infrastructure projects

Explanation:

The primary purpose of issuing government bonds is to finance government expenditures, including infrastructure projects and other spending initiatives.

Question 5. How does public debt affect future generations?

  1. It has no impact on future generations as it is repaid through fiscal consolidation measures.
  2. It reduces the burden on future generations as they benefit from increased government spending.
  3. It may lead to higher taxes and debt servicing costs for future generations.
  4. It stimulates economic growth and ensures a better future for the next generation.

Answer: 3. It may lead to higher taxes and debt servicing costs for future generations.

Explanation:

Public debt may lead to higher taxes and debt servicing costs for future generations as they may be required to repay the debt incurred by the government.

Question 6. What is the role of credit rating agencies in public debt?

  1. To invest in government bonds and assess their credit risk
  2. To determine the value of government bonds in the financial market
  3. To provide credit ratings for government bonds based on their risk and creditworthiness
  4. To regulate the issuance of government bonds in the international market.

Answer: 3. To provide credit ratings for government bonds based on their risk and creditworthiness

Explanation:

Credit rating agencies assess the risk and creditworthiness of government bonds and provide credit ratings that help investors evaluate the safety of investing in these bonds.

Question 7. What is the impact of a higher credit rating on government bonds?

  1. It leads to lower interest rates on government bonds and reduces the cost of borrowing for the government.
  2. It leads to higher interest rates on government bonds and increases the cost of borrowing for the government.
  3. It has no impact on interest rates as government bonds are risk-free.
  4. It encourages foreign governments to borrow from the issuing country.

Answer: 1. It leads to lower interest rates on government bonds and reduces the cost of borrowing for the government.

Explanation:

A higher credit rating on government bonds indicates lower credit risk, which leads to lower interest rates on these bonds, reducing the cost of borrowing for the government.

Question 8. How does public debt impact a country’s fiscal sustainability?

  1. Public debt has no impact on fiscal sustainability as it is a common financial practice.
  2. Public debt enhances fiscal sustainability by increasing government revenue.
  3. Public debt may lead to fiscal instability if not managed properly.
  4. Public debt ensures fiscal sustainability by reducing the budget deficit.
  5. Answer: 3. Public debt may lead to fiscal instability if not managed properly.

Explanation:

Public debt may lead to fiscal instability if it is not managed properly, as excessive debt levels can increase debt servicing costs and hinder the government’s ability to meet its financial obligations. Proper management is essential for fiscal sustainability.

Budget As An Instrument Of Fiscal Policy

Question 1. How is the budget used as an instrument of Fiscal Policy?

  1. By controlling the money supply and interest rates
  2. By regulating foreign exchange rates and trade balances
  3. Adjusting government spending and taxation to achieve economic objectives
  4. By issuing government bonds to finance infrastructure projects

Answer: 3. By adjusting government spending and taxation to achieve economic objectives

Explanation:

The budget is used as an instrument of Fiscal Policy by adjusting government spending and taxation to achieve various economic objectives, such as stimulating economic growth or controlling inflation.

Question 2. What is the relationship between the budget deficit and Fiscal Policy?

  1. A budget deficit indicates that Fiscal Policy is expansionary.
  2. A budget deficit indicates that Fiscal Policy is contractionary.
  3. A budget deficit has no relation to Fiscal Policy.
  4. A budget deficit indicates that monetary policy is expansionary.

Answer: 1. A budget deficit indicates that Fiscal Policy is expansionary.

Explanation:

A budget deficit indicates that the government is spending more than it is collecting in revenue, which is typically associated with an expansionary Fiscal Policy aimed at stimulating economic growth.

Question 3. During an economic recession, what approach is the government likely to take with the budget?

  1. Increase government spending and reduce taxes to boost economic growth
  2. Reduce government spending and increase taxes to control inflation
  3. Maintain the current budget and wait for the economy to recover naturally
  4. Shift the budget focus towards defense and security spending

Answer: 1. Increase government spending and reduce taxes to boost economic growth

Explanation:

During an economic recession, the government is likely to use an expansionary Fiscal Policy by increasing government spending and reducing taxes to stimulate economic growth.

Question 4. How can a budget surplus be used as an instrument of Fiscal Policy?

  1. Investing the surplus in foreign markets to generate higher returns
  2. By increasing government spending on social welfare programs
  3. By using the surplus to repay public debt and reduce interest payments
  4. Reducing tax rates to stimulate consumer spending

Answer: 3. By using the surplus to repay public debt and reduce interest payments.

Explanation:

A budget surplus can be used as an instrument of Fiscal Policy by using the surplus to repay public debt, which reduces interest payments and contributes to fiscal sustainability.

Question 5. How does an expansionary budget impact economic growth?

  1. It reduces economic growth due to increased government intervention.
  2. It stimulates economic growth by increasing government spending and boosting aggregate demand.
  3. It has no impact on economic growth as budgets are balanced.
  4. It stimulates economic growth by reducing government spending and increasing tax revenue.

Answer: 4. It stimulates economic growth by increasing government spending and boosting aggregate demand.

Explanation:

An expansionary budget stimulates economic growth by increasing government spending on various projects and programs, which in turn boosts aggregate demand and economic activity.

Question 6. How can a budget deficit be managed effectively?

  1. By increasing government spending to stimulate economic growth
  2. By reducing tax rates to encourage private investment
  3. By implementing austerity measures and reducing unnecessary expenses
  4. Printing more money to cover the deficit

Answer: 3. By implementing austerity measures and reducing unnecessary expenses

Explanation:

A budget deficit can be managed effectively by implementing austerity measures, cutting unnecessary expenses, and focusing on essential government spending to bring the budget back
to balance.

Question 7. During an inflationary period, what approach is the government likely to take with the budget?

  1. Increase government spending and reduce taxes to stimulate economic growth
  2. Reduce government spending and increase taxes to control inflation
  3. Maintain the current budget and wait for inflation to stabilize naturally
  4. Shift the budget focus towards defense and security spending

Answer: 2. Reduce government spending and increase taxes to control inflation

Explanation:

During an inflationary period, the government is likely to use a contractionary Fiscal Policy by reducing government spending and increasing taxes to control inflation and reduce aggregate demand.

Question 8. What is the significance of a well-balanced budget for Fiscal Policy?

  1. A well-balanced budget indicates that Fiscal Policy is expansionary.
  2. A well-balanced budget indicates that Fiscal Policy is contractionary.
  3. A well-balanced budget ensures fiscal sustainability and financial stability.
  4. A well-balanced budget leads to higher interest rates and debt servicing costs.

Answer: 3. A well-balanced budget ensures fiscal sustainability and financial stability.

Explanation:

A well-balanced budget, where government revenue equals government spending, ensures fiscal sustainability and financial stability, indicating that the government is managing its finances effectively.

Fiscal Policy For Long-run Economic Growth

Question 1. What is the primary objective of Fiscal Policy for long-run economic growth?

  1. To control inflation and stabilize the economy
  2. To achieve short-term economic stability
  3. To stimulate economic growth and increase aggregate demand
  4. To promote sustainable and steady economic growth over

Answer: 4. To promote sustainable and steady economic growth over time

Explanation:

The primary objective of Fiscal Policy for long-run economic growth is to promote sustainable and steady economic growth over time, ensuring the economy’s stability and prosperity in the future.

Question 2. How can the government use Fiscal Policy to promote long-run economic growth?

  1. By increasing government spending during economic downturns
  2. Implementing contractionary policies to control inflation
  3. Reducing taxes to stimulate consumer spending
  4. By investing in infrastructure and human capital development

Answer: 4. By investing in infrastructure and human capital development

Explanation:

The government can use Fiscal Policy to promote long-run economic growth by investing in infrastructure* projects and human capital development, which enhances the economy’s productivity and potential growth.

Question 3. Which sector does the government typically prioritize for long-run economic growth?

  1. Defense and security sector
  2. Financial and banking sector
  3. Export-oriented industries
  4. Infrastructure and education sector

Answer: 4. Infrastructure and education sector

Explanation:

The government typically prioritizes investment in the infrastructure and education sector to promote long-run economic growth as these areas contribute to the economy productivity and human capital development.

Question 4. How does investment in research and development contribute to long-run economic growth?

  1. It increases government revenue and reduces the budget deficit.
  2. It reduces unemployment and stimulates economic growth in the short term.
  3. It promotes technological advancements and enhances productivity.
  4. it increases foreign direct investment and improves trade balances.

Answer: 3. It promotes technological advancements and enhances productivity.

Explanation:

Investment in research and development promotes technological advancements, leading to increased productivity and innovation, which are essential for long-run economic growth.

Question 5. What role does Fiscal Policy play in addressing income inequality for long-run economic growth?

  1. Fiscal Policy has no impact on income inequality in the long run.
  2. Fiscal Policy reduces income inequality through wealth redistribution measures.
  3. Fiscal Policy increases income inequality by favoring higher-income groups.
  4. Fiscal Policy addresses income inequality through short-term subsidies.

Answer: 2. Fiscal Policy reduces income inequality through wealth redistribution measures.

Explanation:

Fiscal Policy can play a role in addressing income inequality for long-run economic growth by implementing wealth redistribution measures, such as progressive taxation and social welfare programs.

Question 6. How does a stable macroeconomic environment contribute to long-run economic growth?

  1. It leads to higher inflation and higher interest rates.
  2. It increases uncertainty and discourages investment.
  3. It fosters confidence and encourages private-sector investment.
  4. It leads to budget deficits and excessive government borrowing.

Answer: It fosters confidence and encourages private-sector investment.

Explanation:

A stable macroeconomic environment fosters confidence among businesses and investors, encouraging private sector investment, which is crucial for long-run economic growth.

Question 7. What is the significance of fiscal discipline in achieving long-run economic growth?

  1. Fiscal discipline leads to higher public debt and increased government spending.
  2. Fiscal discipline ensures that government spending aligns with economic priorities. .
  3. Fiscal discipline leads to higher inflation and currency depreciation.
  4. Fiscal discipline has no impact on long-run economic growth.

Answer: 2. Fiscal discipline ensures that government spending aligns with economic priorities.

Explanation:

Fiscal discipline is significant for achieving long-run economic growth as it ensures that government spending aligns with economic priorities, leading to more efficient allocation of resources.

Question 8. How does investment in education contribute to long-run economic growth?

  1. It increases government revenue through higher taxation.
  2. It reduces government expenditure on social welfare programs.
  3. It enhances human capital and improves labor productivity.
  4. It increases foreign direct investment and trade balances.

Answer: 3. It enhances human capital and improves labor productivity.

Explanation:

Investment in education enhances human capital by improving the skills and knowledge of the workforce, leading to higher labor productivity and contributing to long-run economic growth.

Fiscal Policy For Reduction In Inequalities Of Income And Wealth

Question 1. What is the primary objective of Fiscal Policy for reducing inequalities of income and wealth?

  1. To promote economic growth and increase aggregate demand
  2. To achieve short-term economic stability
  3. To stimulate consumer spending through tax cuts
  4. To promote a more equitable distribution of income and wealth

Answer: 4. To promote a more equitable distribution of income and wealth

Explanation:

The primary objective of Fiscal Policy for reducing inequalities of income and wealth is to promote a more equitable distribution of resources and opportunities within the economy.

Question 2. How can the government use Fiscal Policy to reduce income inequality?

  1. By increasing government spending on defense and security
  2. By implementing contractionary policies to control inflation
  3. Reducing tax rates for higher-income groups
  4. By implementing progressive taxation and social welfare programs

Answer: 4. By implementing progressive taxation and social welfare programs

Explanation:

The government can use Fiscal Policy to reduce income inequality by implementing progressive taxation, where higher-income individuals pay higher tax rates, and by implementing social welfare programs to support lower-income groups.

Question 3. What role does Fiscal Policy play in wealth redistribution?

  1. Fiscal Policy has no impact on wealth redistribution in the long run.
  2. Fiscal Policy reduces wealth inequality through progressive taxation and inheritance taxes. .
  3. Fiscal Policy increases wealth inequality by favoring higher-income groups.
  4. Fiscal Policy addresses wealth redistribution through short-term subsidies.

Answer: 2. Fiscal Policy reduces wealth inequality through progressive taxation and inheritance taxes.

Explanation:

Fiscal Policy can play a role in wealth redistribution by implementing progressive taxation and inheritance taxes, which aim to reduce wealth •inequality and promote a more even distribution of wealth.

Question 4. How can the government use social welfare programs to address inequalities?

  1. By providing subsidies to corporations for capital investments
  2. Reducing government spending to decrease the budget deficit
  3. Targeting financial assistance to vulnerable and disadvantaged groups
  4. Implementing tax cuts for high-income individuals

Answer: 3. By targeting financial assistance to vulnerable and disadvantaged groups

Explanation:

The government can use social welfare programs to address inequalities by targeting financial assistance, such as unemployment benefits and healthcare support, to vulnerable and disadvantaged groups in society.

Question 5. How does Fiscal Policy impact the disposable income of low-income individuals?

  1. Fiscal Policy has no impact on disposable income.
  2. Fiscal Policy increases disposable income through tax cuts for higher-income groups.
  3. Fiscal Policy increases- disposable income through tax cuts for lower-income groups.
  4. Fiscal Policy decreases disposable income through higher taxation.

Answer: 3. Fiscal Policy increases disposable income through tax cuts for lower-income groups.

Explanation:

Fiscal Policy can increase disposable income for low-income individuals by implementing tax cuts or providing tax credits targeted at lower-income groups.

Question 6. What is the significance of public spending on education and healthcare for reducing income and wealth inequalities?

  1. Public spending on education and healthcare increases income inequality.
  2. Public spending on education and healthcare has no impact on income and wealth inequalities.
  3. Public spending on education and healthcare reduces income and wealth inequalities by improving access to essential services.
  4. Public spending on education and healthcare leads to higher budget deficits.

Answer: 3. Public spending on education and healthcare reduces income and wealth inequalities by improving access to essential services.

Explanation:

Public spending on education and healthcare can reduce income and wealth inequalities by improving access to quality education and healthcare services for all citizens, regardless of their economic status.

Question 7. What role can Fiscal Policy play in promoting equal opportunities for all citizens?

  1. Fiscal Policy can allocate resources based on political considerations.
  2. Fiscal Policy can favor certain industries and corporations.
  3. Fiscal Policy can provide tax breaks only to higher-income individuals.
  4. Fiscal Policy can support policies that promote education and skill development for all citizens. ,

Answer: 4. Fiscal Policy can support policies that promote education and skill development for all citizens.

Explanation:

Fiscal Policy can play a role in promoting equal opportunities by supporting policies that invest in education and skill development, ensuring that all citizens have access to opportunities for personal and economic growth.

Question 8. How does an increase in the minimum wage contribute to reducing income inequality?

  1. An increase in the minimum wage has no impact on income inequality. ‘
  2. An increase in the minimum wage reduces income inequality by raising the earnings of low-income workers.
  3. An increase in the minimum wage widens income inequality by reducing profits for businesses.
  4. An increase in the minimum wage leads to higher unemployment and income disparities.

Answer: 2. An increase in the minimum wage reduces income inequality by raising the earnings of low-income workers.

Explanation: 

An increase in the minimum wage can reduce income inequality by raising the earnings of low-income workers, thereby narrowing the income gap between high and low-income individuals.

 Limitations Of Fiscal Policy

Question 1. What are the limitations of Fiscal Policy in managing the economy?

  1. Fiscal Policy is not effective in influencing aggregate demand.
  2. Fiscal Policy can only be implemented during periods of economic expansion.
  3. Fiscal Policy can lead to inflation and currency depreciation.
  4. Fiscal Policy is not a suitable tool for addressing income inequality

Answer: 1. Fiscal Policy is not effective in influencing aggregate demand.

Explanation:

One of the limitations of Fiscal Policy is that it may not always be effective in influencing aggregate demand, especially during certain economic conditions, such as liquidity traps or when consumers and, businesses are not responsive to changes in taxation and government spending.

Question 2. What happens when Fiscal Policy is implemented with a time lag?

  1. It leads to immediate and effective results in the economy.’
  2. It increases the effectiveness of Fiscal Policy in managing inflation.
  3. It may lead to a mismatch between the timing of the policy measures and the economic conditions.
  4. It reduces the impact of Fiscal Policy on economic growth.

Answer: 3. It may lead to a mismatch between the timing of the policy measures. and the economic conditions.

Explanation:

When Fiscal Policy is implemented with a time lag, there may be a mismatch between the timing of the policy measures and the prevailing economic conditions, which can reduce the effectiveness of the policy in addressing economic issues.

Question 3. What is the crowding-out effect of Fiscal Policy?

  1. It refers to an increase in private investment due to government spending.
  2. It refers to a decrease in private investment due to government borrowing.
  3. It refers to the increase in consumer spending due to government tax cuts.
  4. It refers to the reduction in government expenditure to control inflation.

Answer: 2. It refers to a decrease in private investment due to government borrowing.

Explanation:

The crowding-out effect refers to a decrease in private investment that occurs when the government borrows funds from the financial market to finance its spending, leading to higher interest rates and reduced private investment.

Question 4. What is the fiscal imprudence limitation of Fiscal Policy?

  1. It refers to the government’s inability to implement tax cuts effectively.
  2. It refers to the risk of a budget surplus leading to economic instability.
  3. It refers to the risk of excessive government borrowing and budget deficits.
  4. It refers to the government’s inability to reduce public debt.

Answer: 3. It refers to the risk of excessive government borrowing and budget deficits.

Explanation:

Fiscal imprudence refers to the risk of excessive government borrowing and budget deficits, which can lead to fiscal instability and debt sustainability issues in the long run.

Question 5. How can international factors limit the effectiveness of Fiscal Policy?

  1. International factors have no impact on Fiscal Policy.
  2. International factors can lead to fluctuations in exchange rates.
  3. International factors can influence the level of government revenue.
  4. International factors can affect the effectiveness of export-oriented policies.

Answer: 4. International factors can affect the effectiveness of export-oriented policies.

Explanation:

International factors, such as changes in global demand and trade conditions, can influence the effectiveness of export-oriented Fiscal Policy, which aims to promote exports and economic growth.

Question 6. What is the Ricardian Equivalence proposition?

  1. It suggests that changes in government spending have no impact on aggregate demand.
  2. It suggests that tax cuts increase disposable income and boost consumer spending.
  3. It suggests that changes in government debt have no impact on the economy.
  4. It suggests that consumers may offset tax cuts by increasing their savings.

Answer: 4. It suggests that consumers may offset tax cuts by increasing their savings.

Explanation:

The Ricardian Equivalence proposition suggests that consumers may anticipate future tax increases to finance government debt and, therefore, may increase their savings to offset any potential tax cuts.

Question 7. How can political considerations limit the effectiveness of Fiscal Policy?

  1. Political considerations may lead to excessive government. spending.
  2. Political considerations can delay the implementation of Fiscal Policy measures.
  3. Political considerations have no impact on Fiscal Policy decisions.
  4. Political considerations can lead to a reduction in taxation.

Answer: Political considerations can delay the implementation of Fiscal Policy measures.

Explanation:

Political considerations can influence Fiscal Policy decisions and may lead to delays in implementing necessary measures, which can hinder the timely and effective response to economic challenges.

Question 8. What is the risk associated with using Fiscal Policy as the primary tool for stabilization?

  1. The risk of inflation is due to increased government spending.
  2. The risk of exchange rate volatility due to changes in tax rates.
  3. The risk of excessive government borrowing and debt accumulation.
  4. The risk of reduced consumer spending due to tax cuts.

Answer: 3. The risk of excessive government borrowing and debt accumulation.

Explanation:

The risk associated with using Fiscal Policy as the primary tool for stabilization is the possibility of excessive government borrowing and debt accumulation, which can lead to fiscal instability and debt sustainability issues in the long term.

Crowding Out

Question 1. What is the crowding-out effect in the context of Fiscal Policy?

  1. It refers to an increase in private investment due to government spending.
  2. It refers to a decrease in private investment due to government borrowing.
  3. It refers to an increase in consumer spending due to government tax cuts.
  4. It refers to the reduction in government expenditure to control inflation.

Answer: 2. It refers to a decrease in private investment due to government borrowing.

Explanation:

The crowding-out effect refers to a decrease in private investment that occurs when the government borrows funds from the financial market to finance its spending, leading to higher interest rates and reduced private investment.

Question 2. How does crowding out occur in the economy?

  1. Crowding out occurs when the government increases its spending to boost economic growth.
  2. Crowding out occurs when the government reduces its spending to control inflation.
  3. Crowding out occurs when the government competes with the private sector for funds in the financial market.
  4. Crowding out occurs when the government increases taxes to reduce aggregate demand.

Answer: 3. Crowding out occurs when the government competes with the private sector for funds in the financial market.

Explanation:

Crowding out occurs when the government competes with the private sector for funds in the financial market to finance its spending, leading to higher interest rates and reduced private sector borrowing and investment.

Question 3. How does crowding out affect interest rates in the economy?

  1. Crowding out has no impact on interest rates as they are determined by the central bank.
  2. Crowding out leads to higher interest rates due to increased government borrowing.
  3. Crowding out leads to lower interest rates due to increased private-sector borrowing.
  4. Crowding out has no impact on interest rates as they are determined by market forces.

Answer: 2. Crowding out leads to higher interest rates due to increased government borrowing.

Explanation:

Crowding out leads to higher interest rates because increased government borrowing reduces the availability of funds in the financial market, leading to higher demand for loans and pushing up interest rates.

Question 4. What is the opportunity cost of crowding out in the economy?

  1. The opportunity cost of crowding out is the potential loss of tax revenue for the government.
  2. The opportunity cost of crowding out is the potential reduction in private investment and economic growth.
  3. The opportunity cost of crowding out is the potential loss of government revenue from taxes.
  4. The opportunity cost of crowding out is the potential increase in government expenditure.

Answer: 2. The opportunity cost of crowding out is the potential reduction in private investment and economic growth.

Explanation:

The opportunity cost of crowding out is the potential reduction in private-sector borrowing and investment, which could lead to lower economic growth and development.

Question 5. How can crowding out impact the effectiveness of Fiscal Policy?

  1. Crowding out increases the effectiveness of Fiscal Policy in stimulating economic growth.
  2. Crowding out has no impact on the effectiveness of Fiscal Policy.
  3. Crowding out reduces the effectiveness of Fiscal Policy in stimulating economic growth.
  4. Crowding out leads to a decrease in government expenditure and budget surplus.

Answer: 1. Crowding out reduces the effectiveness of Fiscal Policy in stimulating economic growth.

Explanation:

Crowding out reduces the effectiveness of Fiscal Policy because higher interest rates and reduced private investment can offset the positive impact of increased government spending on economic growth.

Question 6. What happens to private sector borrowing in the presence of crowding out?

  1. Private sector borrowing decreases due to lower interest rates.
  2. Private sector borrowing increases due to higher interest rates.
  3. Private sector borrowing remains unaffected by crowding out.
  4. Private sector borrowing decreases due to higher taxes.

Answer: 2. Private sector borrowing increases due to higher interest rates.

Explanation:

In the presence of crowding out, private-sector borrowing typically increases due to higher interest rates, which are a result of increased government borrowing.

Question 7. What can the government do to mitigate the crowding-out effect?

  1. The government can increase its borrowing to outcompete the private sector.
  2. The government can reduce taxes to increase private-sector spending.
  3. The government can impose price controls to limit interest rates.
  4. The government can implement austerity measures to reduce spending.

Answer: 2. The government can reduce taxes to increase private sector spending.

Explanation:

To mitigate the crowding-out effect, the government can reduce taxes, allowing individuals and businesses to retain more income, which may increase private sector spending and investment.

Question 8. Which of the following situations is most likely to lead to crowding out in the economy?

  1. A decrease in government borrowing and increased private sector investment.
  2. An increase in government borrowing and increased private sector investment.
  3. A decrease in government borrowing and decreased private sector investment.
  4. An increase in government borrowing and decreased private sector investment.

Answer: 4. An increase in government borrowing and decreased private sector investment.

Explanation:

An increase in government borrowing can lead to crowding out, resulting in decreased private-sector investment due to higher interest rates and reduced availability of funds in the financial market.

Conclusion

Question 1. What is the main objective of Fiscal Policy?

  1. To control inflation and stabilize prices
  2. To achieve short-term economic stability
  3. To promote long-term economic growth and stability
  4. To regulate foreign trade and exchange rates

Answer: 3. To promote long-term economic growth and stability

Explanation:

The main objective of Fiscal Policy is to promote long-term economic growth and stability by managing government spending and taxation to influence the overall economy.

Question 2. How does Fiscal Policy differ from Monetary Policy?

  1. Fiscal Policy focuses on regulating money supply and interest rates, while Monetary Policy manages government spending and taxation.
  2. Fiscal Policy is implemented by the central bank, while Monetary Policy is implemented by the government.
  3. Fiscal Policy involves managing government spending and taxation, while Monetary Policy involves regulating money supply and interest rates.
  4. Fiscal Policy and Monetary Policy are the same and used interchangeably.

Answer: Fiscal Policy involves managing government spending and taxation, ‘ while Monetary Policy involves regulating money supply and interest rates.

Fiscal Policy is concerned with managing government spending and taxation to influence economic conditions, while Monetary Policy deals with regulating money supply and interest
rates to achieve economic goals.

Question 3. How can Fiscal Policy be used to address recessionary conditions in the economy?

  1. Increasing government spending and reducing taxes to boost aggregate demand
  2. Reducing government spending and increasing taxes to control inflation
  3. Implementing austerity measures to reduce the budget deficit
  4. By increasing interest rates to attract foreign investments

Answer: 1. By increasing government spending and reducing taxes to boost aggregate demand

Explanation:

During recessionary conditions, Fiscal. The policy can be used to stimulate the economy by increasing government spending and reducing taxes, which boosts aggregate demand and supports
economic growth.

Question 4. What is the significance of automatic stabilizers in Fiscal Policy?

  1. Automatic stabilizers increase government borrowing to stimulate economic growth.
  2. Automatic stabilizers automatically adjust government spending and taxation in response to economic fluctuations.
  3. Automatic stabilizers reduce government spending during economic downturns.
  4. Automatic stabilizers reduce taxes to control inflation.

Answer: 2. Automatic stabilizers automatically adjust government spending and taxation in response to economic fluctuations.

Explanation:

Automatic stabilizers are built-in features of the Fiscal Policy that automatically adjust government spending and taxation in response to changes in economic conditions, helping to
stabilize the economy during fluctuations.

Question 5. What are the limitations ot Fiscal Policy in managing the economy?

  1. Fiscal Policy is not elective in influencing aggregate demand.
  2. Fiscal Policy can only be implemented during periods of economic expansion.
  3. Fiscal Policy can lead to inflation and currency depreciation.
  4. Fiscal Policy is not a suitable tool for addressing income inequality.

Answer: 1. Fiscal Policy is not effective in influencing aggregate demand.

Explanation:

One of the limitations of Fiscal Policy is that it may not always be effective in influencing aggregate demand, especially during certain economic conditions, such as liquidity traps or when consumers and businesses are not responsive to changes in taxation and government spending.

Question 6. How can political considerations impact the effectiveness of Fiscal Policy?

  1. Political considerations can lead to excessive government spending.
  2. Political considerations can delay the implementation of Fiscal Policy measures.
  3. Political considerations have no impact on Fiscal Policy decisions.
  4. Political considerations can lead to a reduction in taxation.

Answer: 2. Political considerations can delay the implementation of Fiscal Policy measures.

Explanation:

Political considerations can influence Fiscal Policy decisions and may lead to delays in implementing necessary measures, which can hinder the timely and effective response to economic challenges.

Question 7. What is the crowding-out effect of Fiscal Policy?

  1. It refers to an increase in private investment due to government spending.
  2. It refers to a decrease in private investment due to government borrowing.
  3. It refers to an increase in consumer spending due to government tax cuts.
  4. It refers to the reduction in government expenditure to control inflation.

Answer: 2. It refers to a decrease in private investment due to government borrowing.

Explanation:

The crowding-out effect refers to a decrease in private investment that occurs when the government borrows funds from the financial market to finance its spending, leading to higher interest rates and reduced private investment.

Question 8. What is the primary objective of Fiscal Policy for long-run economic growth?

  1. To control inflation and stabilize the economy
  2. To achieve short-term economic stability
  3. To stimulate economic growth and increase aggregate demand
  4. To promote sustainable and steady economic growth over time

Answer: 4. To promote sustainable and steady economic growth over time

Explanation:

The primary objective of Fiscal Policy for long-run economic growth is to promote sustainable and steady economic growth over time, ensuring the economy’s stability and prosperity in the future.
CA Foundation Economics – Market Failure Government Intervention To Correct Market Failure Multiple Choice Questions

Market Failure Government Intervention To Correct Market Failure Introduction

Question 1. Market failure occurs when

  1. The government intervenes in the market to regulate prices.
  2. Demand for a product exceeds its supply in the market.
  3. The market fails to allocate resources efficiently.
  4. The government imposes taxes on goods and services.

Answer: 3. The market fails to allocate resources efficiently.

Explanation:

Market failure occurs when the market fails to allocate resources efficiently, leading to an inefficient allocation of goods and services in the economy. .

Question 2. Which of the following is an example of market failure?

  1. The production of a public good like street lighting.
  2. The availability of luxury goods in the market.
  3. The price increase of a product due to high demand.
  4. The availability of goods and services through competition.

Answer: 1. The production of a public good like street lighting.

Explanation:

The production of a public good like street lighting is an example of market failure, because public goods are non-excludable and non-rivalrous, making it difficult
for private markets to efficiently provide them.

Question 3. Externalities refer to

  1. The costs and benefits affect only the producers in the market.
  2. The costs and benefits that affect both producers and consumers in the market.
  3. The costs and benefits affect only the consumers in the market.
  4. The costs and benefits that have no impact on the market.

Answer: 2. The costs and benefits that affect both producers and consumers in the market.

CA Foundation Economics - Market Failure Government Intervention To Correct Market Failure MCQs

Explanation:

Externalities refer to the costs and benefits that affect both producers and consumers in the market but are not reflected in the market price, leading to an inefficient allocation of resources.

Question 4. When a company pollutes the environment while producing goods, it is an example of

  1. Positive externality.
  2. Negative externality.
  3. Public good.
  4. Market equilibrium.

Answer: 2. Negative externality

Explanation:

When a company pollutes the environment while producing goods, it is an example of a negative externality, as the pollution imposes costs on society that are not fully borne by the company.

Question 5. Government intervention to correct market failure may involve

  1. Reducing taxes to encourage investment.
  2. Providing subsidies to producers to lower costs. v
  3. Imposing price controls to regulate market prices.
  4. Correcting externalities through taxes or subsidies.

Answer: 4. Correcting externalities through taxes or subsidies

Explanation:

Government intervention to correct market failure may involve correcting externalities through taxes on negative externalities or subsidies on positive externalities. This can help internalize the external costs or benefits and lead to a more efficient allocation of resources.

Question 6. Market failure occurs when

  1. The government imposes excessive regulations on businesses
  2. The market is unable to allocate resources efficiently
  3. Consumers demand more goods and services than producers can supply
  4. There is perfect competition among firms in the market

Answer: 2. The market is unable to allocate resources efficiently

Question 7. The main cause of market failure is often attributed to

  1. Excessive government intervention in the economy
  2. Monopoly power held by a single firm in the market
  3. Lack of consumer demand for certain goods and services
  4. Externalities and the absence of property rights

Answer: 4. Externalities and the absence of property rights

Question 8. Externalities refer to

  1. The benefits or costs of production that spill over to affect third parties
  2. The government’s interference in the market
  3. The changes in demand and supply in the market
  4. The fluctuations in the stock market

Answer: 1. The benefits or costs of production that spill over to affect third parties

Question 9. Which of the following is an example of a positive externality?

  1. Pollution from a factory affecting the health of nearby residents
  2. Vaccination programs reduce the spread of infectious diseases
  3. Congestion and traffic jams in urban areas.
  4. The depletion of natural resources due to overexploitation

Answer: 2. Vaccination programs reduce the spread of infectious diseases

Question 10. Government intervention to correct market failure can include

  1. Imposing trade barriers and tariffs on imports
  2. Reducing taxes to stimulate consumer spending
  3. Providing subsidies to inefficient firms in the market
  4. Imposing taxes or regulations to address externalities

Answer: 4. Imposing taxes or regulations to address externalities

Question 11. Public goods are characterized by

  1. Rivalry in consumption and exclusion of non-payers
  2. Rivalry in consumption and non-exclusion of non-payers
  3. Non-rivalry in consumption and exclusion of non-payers
  4. Non-rivalry in consumption and non-exclusion of non-payers

Answer: 4. Non-rivalry in consumption and non-exclusion of non-payers

Question 12. The free-rider problem refers to

  1. Consumers demanding more goods than producers can supply
  2. Firms in the market charging excessively high prices for their products
  3. People benefiting from a public good without contributing to its provision
  4. Government intervention causing market inefficiencies

Answer: 3. People benefiting from a public good without contributing to its provision

Question 13. Government intervention to correct market failure aims to

  1. Completely replace the market mechanism with central planning
  2. Eliminate all externalities and market distortions
  3. Improve market efficiency and promote economic welfare
  4. Privatize all public goods and services

Answer: 3. Improve market efficiency and promote economic welfare

The Concept Of Market Failure

Question 1. Which of the following is an example of a positive externality?

  1. Pollution from a factory affects nearby residents’ health negatively.
  2. A new technology leads to increased productivity in an industry.
  3. Overfishing in an unregulated fishery.
  4. A decrease in consumer spending affects local businesses negatively.

Answer:  2. A new technology leading to increased productivity in an industry.

Explanation:

A positive externality occurs when a third party benefits from a market transaction. In this case, the new technology leading to increased productivity benefits the industry and possibly other related industries.

Question 2. Which of the following is a cause of market failure?

  1. Perfect competition in the market.
  2. Government intervention to correct externalities.
  3. Absence of public goods in the market.
  4. Equilibrium between supply and demand.

Answer: 3. Absence of public goods in the market.

Explanation:

The absence of public goods in the market is a cause of market failure. Public goods, such as national defense or street- -lighting, are non-excludable and non-rivalrous, making it the private sector to provide them efficiently. . –

Question 3. Externalities refer to

  1. The costs and benefits faced by producers in the market.
  2. The positive impacts of government policies on the economy.
  3. The spillover effects of market transactions on third parties.
  4. The ability of consumers to make informed decisions.

Answer: 3. The spillover effects of market transactions on third parties.

Explanation:

Externalities are the spillover effects of- market transactions on third parties who are not directly involved in the transaction. They can be positive (benefits) or
negative (costs).

Question 4. When a company pollutes a nearby river, causing harm to the environment and nearby communities, it is an example of

  1. Positive externality.
  2. Negative externality.
  3. Perfect competition.
  4. Government intervention.

Answer: 2. Negative externality.

Explanation:

The pollution caused by the company, leading to harm to the environment and nearby communities, is an example of a negative externality. The company is not bearing the full costs of its actions, and the negative impact spills over to others.

Question 5. How can the government address market failure due to externalities?

  1. By increasing taxes on the affected firms.
  2. By providing subsidies to the affected firms.
  3. By implementing regulations and standards.
  4. By reducing public goods in the market.

Answer: 2. By implementing regulations and standards.

Explanation:

The government can address market failure due to externalities by implementing regulations and standards on polluting firms or activities, encouraging them to internalize the external costs they impose on society.

Question 6. Market failure occurs when

  1. The government intervenes excessively in the market.
  2. The market is unable to allocate resources efficiently.
  3. Producers dominate the market, leading to reduced competition.
  4. Consumer demand exceeds the available supply of goods.

Answer: 2. The market is unable to allocate resources efficiently.

Explanation:

Market failure occurs when the free market is unable to allocate resources efficiently, leading to suboptimal outcomes such as underproduction or overproduction of goods and services.

Question 7. Which of the following is a cause of market failure?

  1. Perfect competition in the market.
  2. Externalities and public goods.
  3. Government regulations promoting fair trade.
  4. Decrease in consumer demand.

Answer: 2. Externalities and public goods.

Explanation:

Externalities (for example,  pollution) and public goods (e.g., national defense) are examples of causes of market failure where the free market may not account for the full social costs or benefits of certain goods or services.

Question 8. In the presence of negative externalities, the market tends to produce

  1. Less of the good than is socially optimal.
  2. More of the good than is socially optimal.
  3. The socially optimal level of the good.
  4. The good in the most efficient manner.

Answer: 2. More of the good than is socially optimal.

Explanation:

Negative externalities lead to overproduction of goods because the social cost of production is higher than the private cost borne by producers. As a result, the market produces more of the good than is. socially desirable.

Question 9. A public good is characterized by

  1. Rivalry in consumption and excludability.
  2. Non-rivalry in consumption and excludability.
  3. Rivalry in consumption and non-excludability.
  4. Non-rivalry in consumption and non-excludability

Answer: 2. Non-rivalry in consumption and non-excludability.

Explanation:

A public good is non-rivalrous, meaning one person’s use does not reduce the availability for others, and non-excludable, meaning individuals cannot be excluded from using it once provided.

Question 10. Market failure occurs when

  1. The government intervenes too much in the economy
  2. The market allocates resources efficiently
  3. The market fails to allocate resources efficiently
  4. There is perfect competition among firms in the market

Answer: 3. The market fails to allocate resources efficiently

Question 11. The main cause of market failure is often attributed to

  1. Perfect competition among firms in the market
  2. The absence of government regulations
  3. Externalities and market imperfections
  4. High levels of consumer demand

Answer: 3. Externalities and market imperfections

Question 12. Externalities refer to

  1. The government’s role in the market
  2. The benefits or costs of production that spill over to affect third parties
  3. The changes in supply and demand in the market
  4. The fluctuations in stock prices

Answer: 2. The benefits or costs of production that spill over to affect third parties

Question 13. Which of the following is an example of a negative externality?

  1. A company providing scholarships to local students
  2. The construction of a new park in the neighborhood
  3. Pollution from a factory affecting nearby residents
  4. Government subsidies to support renewable energy

Answer: 3. Pollution from a factory affecting nearby residents

Question 14. Public goods are characterized by

  1. Rivalry in consumption and exclusion of non-payers
  2. Rivalry in consumption and noh-exclusion of non-payers
  3. Non-rivalry in consumption and exclusion of non-payers
  4. Non-rivalry in consumption and non-exclusion of non-payers

Answer: 4. Non-rivalry in consumption and non-exclusion of non-payers

Question 15. The free-rider problem refers to

  1. Consumers demanding more goods than producers can supply
  2. Firms in the market charging excessively high prices for their products
  3. People benefiting from a public good without contributing to its provision
  4. Government intervention causing market inefficiencies

Answer: 3. People benefiting from a public good without contributing to its provision

Question 16. Which of the following is an example of market failure?

  1. A competitive market with many buyers and sellers
  2. A perfectly efficient allocation of resources in a free market
  3. Overconsumption of natural resources leads to environmental degradation
  4. Government subsidies promoting the growth of a specific industry

Answer: 3. Overconsumption of natural resources leads to environmental degradation

Question 17. Government intervention to correct market failure aims to

  1. Eliminate all externalities and market distortions
  2. Replace the market mechanism with central planning
  3. Reduce competition and increase market power for firms
  4. Improve market efficiency and promote economic welfare

Answer:  4. Improve market efficiency and promote economic welfare

Explanation:

Government intervention to correct market failure is intended to improve market efficiency and address the inefficiencies caused by externalities, public goods, and other market imperfections. It is not about completely replacing the market mechanism but rather about enhancing its functioning for the overall benefit of society

 Why Do Markets Fail

Question 1. Which of the following is an example of a negative externality?

  1. A new technology leads to increased productivity in an industry.
  2. Pollution from a factory affects nearby residents’ health negatively.
  3. A decrease in consumer spending affects local businesses negatively.
  4. Government subsidies encouraging the production of a specific good

Answer: 2. Pollution from a factory affects nearby residents’ health negatively.

Explanation:

A negative externality occurs when a third party is harmed by a market transaction. In this case, pollution from the factory negatively affects the health of nearby residents, which is a form of market failure.

Question 2. Which of the following is a reason for market failure?

  1. Perfect competition in the market.
  2. Government regulations promoting fair trade.
  3. Externalities and public goods.
  4. Increase in consumer demand.

Answer: 3. Externalities and public goods.

Explanation:

Externalities (For example Pollution) and public goods (For example National defense) are reasons for market failure where the free market may not account for the full social costs or benefits of certain goods or services.

Question 3. When a market is characterized by information asymmetry, it means that

  1. Consumers have more information than producers.
  2. Producers have more information than consumers.
  3. Both consumers and producers have equal access to information.
  4. The market is perfectly efficient with no information gaps.

Answer: 2. Producers have more information than consumers.

Explanation:

Information asymmetry occurs when one party in a transaction (usually producers) has more information than the other party (consumers). This can lead to adverse selection and moral hazard problems, contributing to market failure.

Question 4. Public goods are non-excludable, which means

  1. Individuals can be excluded from using them.
  2. They are available only to the public sector.
  3. They are available only to low-income individuals.
  4. Individuals cannot be excluded from using them.

Answer: 1. Individuals cannot be excluded from using them.

Explanation:

Public goods are non-excludable, meaning individuals cannot be excluded from using them once they are provided. This characteristic creates a free-rider problem and leads to market failure.

Question 5. Which of the following is a reason why markets fail?

  1. Perfect competition among firms.
  2. Absence of externalities.
  3. Adequate provision of public goods.
  4. Information asymmetry.

Answer: 4. Information asymmetry.

Explanation:

Information asymmetry is a reason why markets fail. It occurs when one party in a transaction has more information than the other, leading to unequal knowledge and potentially unfair outcomes.

Question 6. When external costs are not accounted for in the market price of a good, it leads to

  1. Overproduction of the good.
  2. Underproduction of the good.
  3. Optimal production of the good.
  4. Equilibrium production of the good.

Answer: 1. Overproduction of the good.

Explanation:

When external costs (negative externalities) are not considered in the market price, the production of the good tends to be higher than the socially optimal level, leading to overproduction.

Question 7. Which of the following is a market failure caused by incomplete information?

  1. Perfect competition.
  2. Monopoly power
  3. Moral hazard in insurance markets.
  4. Efficient allocation of resources.

Answer: 3. Moral hazard in insurance markets.

Explanation:

A moral hazard in insurance markets is a market failure caused by incomplete information. It occurs when one party (insure(d) alters their behavior due to being protected against risk, and the other party (insurer) cannot fully monitor the actions.

Question 8. Public goods are typically underprovided in the market because

  1. They are non-excludable.
  2. They are rivalrous in consumption.
  3. The government doesn’t regulate their production.
  4. Private firms find them unprofitable.

Answer: 4. Private firms find them unprofitable.

Explanation:

Public goods are typically underprovided in the market because private firms find it unprofitable to produce them. Since public goods are non-excludable and non-rivalrous, firms cannot charge individual consumers and may avoid production due to the inability to capture revenues.

Question 9. Monopolies can lead to market failure because

  1. They produce goods efficiently at lower prices.
  2. They have a larger market share.
  3. They restrict output and charge higher prices.
  4. They promote competition.

Answer: 3. They restrict output and charge higher prices.

Explanation:

Monopolies can lead to market failure because they have the power to restrict output and charge higher prices due to their lack of competition. This can result in inefficient allocation of resources and reduced consumer welfare.

Question 10. Market failure occurs when

  1. The government intervenes too much in the economy
  2. The market allocates resources efficiently
  3. The market fails to allocate resources efficiently
  4. There is perfect competition among firms in the market

Answer: 3. The market fails to allocate resources efficiently

Question 11. Which of the following is a reason why markets fail?

  1. Lack of consumer demand for goods and services
  2. Excessive government regulations in the market
  3. High levels of competition among firms
  4. Efficient allocation of resources by the market

Answer: 1. Lack of consumer demand for goods and services

Question 12. Externalities refer to

  1. The government’s role in the market
  2. The benefits or costs of production that spill over to affect third parties
  3. The changes in supply and demand in the market
  4. The fluctuations in stock prices

Answer: 2. The benefits or costs of production that spill over to affect third parties

Question 13. Which of the following is an example of a negative externality?

  1. A company providing scholarships to local students
  2. The construction of a new park in the neighborhood
  3. Pollution from a factory affecting nearby residents
  4. Government subsidies to support renewable energy

Answer: 3. Pollution from a factory affecting nearby residents

Question 14. Public goods are characterized by

  1. Rivalry in consumption and exclusion of non-payers
  2. Rivalry in consumption and non-exclusion of non-payers
  3. Non-rivalry in consumption and exclusion of non-payers
  4. Non-rivalry in consumption and non-exclusion of non-payers

Answer: 4. Non-rivalry in consumption and non-exclusion of non-payers

Question 15. The free-rider problem refers to

  1. Consumers demanding more goods than producers can supply
  2. Firms in the market charging excessively high prices for their products
  3. People benefiting from a public good without contributing to its provision
  4. Government intervention causing market inefficiencies

Answer: 3. People benefiting from a public good without contributing to its provision

Question 16. Which of the following is a reason for market failure?

  1. Well-defined property rights and contract enforcement
  2. Perfect information and transparency in the market
  3. Externalities and market imperfections
  4. Equal distribution of income among consumers

Answer: 3. Externalities and market imperfections

Question 17. Government intervention to correct market failure aims to

  1. Eliminate all externalities and market distortions
  2. Replace the market mechanism with central planning
  3. Reduce competition and increase market power for firms
  4. Improve market efficiency and promote economic welfare

Answer: 4. Improve market efficiency and promote economic welfare

Explanation:

Government intervention to correct market failure is intended to improve market efficiency and address the inefficiencies caused by externalities, public goods, and other market imperfections. The goal is to promote overall economic welfare and enhance the functioning of the market.

Market Power

Question 1. What is market power?

  1. The ability of a company to set prices arbitrarily high
  2. The ability of a company to influence market outcomes
  3. The ability of a company to manipulate consumer preferences
  4. The ability of a company to engage in predatory pricing

Answer: 2. The ability of a company to influence market outcomes

Explanation:

Market power refers to the ability of a firm or a group of firms to influence the market’s price, output, or other market-related factors. Firms with market power can act independently of the market forces and have some control over price-setting and market outcomes.

Question 2. Which of the following is an example of a perfectly competitive market?

  1. The market for smartphones with several dominant companies
  2. The market for agricultural products with many small-scale farmers
  3. The market for luxury watches with a few high-end brands
  4. The market for electric vehicles with one leading manufacturer

Answer: 2. The market for agricultural products with many small-scale farmers

Explanation:

In a perfectly competitive market, many small buyers and sellers deal with identical or homogeneous products. No single firm has market power and the price is determined solely by the forces of supply and demand. The market for agricultural products, with numerous small-scale farmers selling similar goods, aligns with the characteristics of a perfectly competitive market.

Question 3. A monopoly exists when

  1. There is a single seller, and there are no close substitutes for the product.
  2. There are a few dominant sellers, and they collude to set prices.
  3. Multiple sellers are offering identical products.
  4. The government regulates the prices of goods in the market.

Answer: 1. There is a single seller, and there are no close substitutes for the „ product.

Explanation:

A monopoly is a market structure where there is only one seller or producer of a product or service. There are no close substitutes available in the market, and the monopolistic firm has significant market power, allowing it to set prices and control the quantity supplied.

Question 4. Which of the following is a characteristic of an oligopoly?

  1. A large number of sellers in the market,
  2. Identical products offered by all firms
  3. Little to no barriers to entry for new firms
  4. Interdependence among the firms in the market

Answer: 4. Interdependence among the firms in the market

Explanation:

An oligopoly is a market structure characterized by a small number of dominant firms that dominate the market. These firms are interdependent, meaning the actions of one firm directly impact the other firms in the market. Oligopolistic firms are constantly monitoring and reacting to their competitors’ actions, especially regarding pricing and output decisions.

Question 5. Which of the following strategies is typical of a monopolistic competition?

  1. High barriers to entry for new firms
  2. Identical products offered by all firms
  3. Heavy reliance on non-price competition
  4. Price-setting by a central authority

Answer: 3. Heavy reliance on non-price competition

Explanation:

  1. Monopolistic competition is a market structure where many firms are selling differentiated products, which means the products are similar but not identical.
  2. To differentiate their products from competitors, firms rely on non-price competition, such as advertising, branding, product differentiation, and customer service.
  3. Unlike perfect competition, monopolistic competition does not involve identical products or price-taking behavior.

Externalities

Question 1. What is an externality?

  1. A situation where a company produces goods more efficiently than its competitors
  2. A cost or benefit that affects a party who did not choose to incur that cost or benefit
  3. A condition in which the price of a product exceeds its production cost
  4. An agreement between two firms to fix prices in the market

Answer: 2.  A cost or benefit that affects a party who did not choose to incur that cost or benefit

Explanation:

An externality is a side effect or consequence of an economic activity that affects other parties who did not choose to be involved in that activity. Externalities can be positive (beneficial) or negative (costly) and can arise from production or consumption activities.

Question 2. Which of the following is an example of a negative externality?

  1. A company providing free health check-ups to its employees
  2. Planting trees in a neighborhood park
  3. A factory releasing pollutants into a nearby river
  4. Offering discounts on products to attract more customers

Answer: 2. A factory releasing pollutants into a nearby river

Explanation:

A negative externality occurs when an economic activity imposes costs on third parties who are not involved in the activity. In this case, the pollution released by the factory affects the environment and potentially harms people living near the river, making it a negative externality.

Question 3. Which statement best describes a positive externality?

  1. An increase in the price of a good leads to a decrease in its demand.
  2. Subsidizing the production of solar panels to promote renewable energy.
  3. The consumption of cigarettes leads to adverse health effects for smokers.
  4. A decrease in consumer income leads to a decrease in the consumption of luxury goods.

Answer: 2. Subsidizing the production of solar panels to promote renewable energy.

Explanation:

A positive externality occurs when an economic activity creates benefits for third parties who are not directly involved in the activity. In this case, subsidizing solar panels encourage the production of renewable energy, which not only benefits the producers but also ‘contributes positively to the environment and society.

Question 4. What is the most effective way to internalize externalities?

  1. Government intervention through regulations and taxes
  2. Imposing price ceilings on goods and services
  3. Encouraging monopolies to dominate the market
  4. Allowing markets to reach equilibrium naturally

Answer: Government intervention through regulations and taxes

Explanation:

Government intervention through regulations and taxes is the most effective way to internalize externalities. By imposing taxes on activities that generate negative externalities or providing subsidies for activities with positive externalities, the government can align private costs and benefits with social costs and benefits.

Question 5. Which market structure is most likely to neglect externalities?

  1. Perfect competition
  2. Monopoly
  3. Oligopoly
  4. Monopolistic competition

Answer: 1. Perfect competition

Explanation:

Perfectly competitive markets are less likely to consider externalities because the focus is primarily on maximizing individual profits. In perfect competition, firms are price-takers and. have no market power to influence prices or externalities. As a result, they may neglect the costs or benefits imposed on others, leading to an inefficient allocation of resources.

Public Goods

Question 1. Public goods are characterized by

  1. Rivalry in consumption and excludability
  2. Non-rivalry in consumption and excludability
  3. Rivalry in consumption and non-excludability
  4. Non-rivalry in consumption and non-excludability

Answer:  4. Non-rivalry in consumption and non-excludability.

Explanation:

Public goods are non-rivalrous, meaning one person’s use does not reduce the availability for others, and non-excludable, meaning individuals cannot be excluded from using them once provided.

Question 2. Which of the following statements is true about public goods?

  1. Public goods can be easily provided by private firms for profit.
  2. The free-rider problem is not a concern for public goods.
  3. Public goods have a competitive market price.
  4. Public goods are typically provided by the government or public sector.

Answer: 4. Public goods are typically provided by the government or public sector.

Explanation:

Public goods are often provided by the government or public sector because private firms may find it unprofitable to produce them due to the inability to exclude non-payers and the free-rider problem.

Question 3. The free-rider problem associated with public goods refers to

  1. Individuals who benefit from public goods but refuse to pay for them.
  2. The lack of competition among providers of public goods.
  3. The government’s inability to regulate public goods effectively.
  4. The high costs of production are associated with public goods.

Answer: 1. Individuals who benefit from public goods but refuse to pay for them.

Explanation:

The free-rider problem occurs when individuals can enjoy the benefits of public goods without paying for them. This creates an incentive for some individuals to avoid contributing, leading to potential under-provision of public goods in the absence of government intervention.

Question 4. Which of the following is an example of a public good?

  1. Private luxury goods like designer handbags.
  2. Cable television service.
  3. National defense and military protection.
  4. Exclusive membership at a country club.

Answer: 3. National defense and military protection

Explanation:

National defense and military protection are examples of public goods because they are non-rivalrous and non-excludable. Once provided, these services benefit the entire society, and it is difficult to exclude individuals from enjoying their benefits.

Question 5. The concept of “free-rider” in the context of public goods refers to

  1. Individuals who benefit from public goods without contributing to their provision.
  2. Individuals who willingly pay for public goods.
  3. Public sector employees are responsible for providing public goods.
  4. Non-profit organizations that supply public goods.

Answer: 1. Individuals who benefit from public goods without contributing to their provision.

Explanation:

The concept of “free-rider” in the context of public goods refers to individuals who benefit from the provision of public goods without contributing their fair share towards their production or provision.

Question 6. The free-rider problem refers to the situation where

  1. The government provides goods and services without charging any taxes.
  2. Individuals benefit from a public good without contributing to its provision.
  3. Private companies offer goods for free to attract more customers.
  4. The supply of a public good exceeds its demand.

Answer: 2. Individuals benefit from a public good without contributing to its . provision.

Explanation:

The free-rider problem occurs when individuals benefit from a public good without contributing to its provision or cost. Since public, goods are non-excludable, individuals can enjoy the benefits without paying for it, leading to underproduction or inadequate provision of the good.

Question 7. Which of the following is an example of a pure public good?

  1. Cable TV subscription with different channels.
  2. Toll road with limited access.
  3. National defense is provided by the government.
  4. Private tutoring service for individual students.

Answer: 3. National defense provided by the government.

Explanation:

The national defense provided by the government is an example of a pure public good because it is non-excludable (cannot exclude citizens from protection) and non-rivalrous (protecting one citizen does not diminish the protection of others).

Question 8. Public goods face challenges in the free market because

  1. Private firms can charge high prices for them.
  2. They are produced by the government.
  3. They are subject to demand and supply fluctuations.
  4. They may be underprovided due to the free-rider problem.

Answer: 4. They may be underprovided due to the free-rider problem.

Explanation: 

Public goods may be underprovided in the free market due to the free-rider problem, where individuals have an incentive to enjoy the benefits of the good without paying for it, leading to insufficient incentives for private firms to produce them.

Incomplete Information

Question 1. Incomplete information in a market refers to

  1. The lack of government regulations in the market.
  2. The presence of externalities in the market.
  3. The absence of competition among firms in the market.
  4. Situations where one party in a transaction has more information ” than the other.

Answer: 4. Situations where one party in a transaction has more information than the other.

Explanation:

Incomplete information in a market occurs when one party in a transaction possesses more information than the other party, leading to unequal knowledge and potentially unfair outcomes.

Question 2. Moral hazard is an example of incomplete information in

  1. Insurance markets.
  2. Perfectly competitive markets.
  3. Monopoly markets.
  4. Labor markets.

Answer: 1. Insurance markets.

Explanation:

Moral hazard is an example of incomplete information in insurance markets. It occurs when one party alters their behavior after becoming insured, and the other party cannot fully monitor the actions.

Question 3. Adverse selection is a situation where

  1. Buyers and sellers have equal knowledge about a product.
  2. High-quality goods dominate the market.
  3. Low-quality goods are more likely to be traded.
  4. The market is characterized by perfect competition.

Answer: 3. Low-quality goods are more likely to be traded.

Explanation:

Adverse selection is a situation where low-quality goods or products are more likely to be traded due to information asymmetry. This occurs because the seller has more information about the quality of the product than the buyer.

Question 4. How does incomplete information impact market outcomes?

  1. It leads to a more efficient allocation of resources.
  2. It results in higher prices for goods and services.
  3. It reduces transaction costs in the market.
  4. It may lead to market failure and suboptimal outcomes.

Answer: 4. It may lead to market failure and suboptimal outcomes.

Explanation:

Incomplete information can lead to market failure as it disrupts the efficient functioning of markets, resulting in suboptimal outcomes such as adverse selection, moral hazard, and potentially inefficient resource allocation.

Question 5. Solutions to the problem of incomplete information in markets may include

  1. Eliminating government regulations.
  2. Encouraging monopolies to dominate the market.
  3. Enhancing transparency and disclosure of information.
  4. Reducing competition among firms.

Answer: 3. Enhancing transparency and disclosure of information. Explanation: .

One of the solutions to the problem of incomplete information in markets is to enhance transparency and disclosure of information. This allows all parties involved in a transaction to make more informed decisions, reducing information asymmetry and potential market failures.

Question 6. Incomplete information in the market refers to a situation where

  1. Consumers have perfect knowledge about the quality and price of goods.
  2. Sellers have perfect knowledge of consumer preferences.
  3. Market participants have unequal access to information.
  4. The government regulates the flow of information in the market.

Answer: 3. Market participants have unequal access to information.

Explanation:

Incomplete information in the market occurs when some market participants have more or better information than others, leading to an information asymmetry.

Question 7. Adverse selection in the insurance market refers to

  1. Insurance companies charge high premiums for high-risk individuals.
  2. High-risk individuals select insurance policies with high deductibles.
  3. High-risk individuals are more likely to buy insurance.
  4. Insurance companies exclude high-risk individuals from coverage.

Answer: 3. High-risk individuals are more likely to buy insurance.

Explanation:

Adverse selection in the insurance market occurs when high-risk individuals are more likely to buy insurance, leading to an imbalanced pool of insured individuals and potentially higher premiums.

Question 8. Moral hazard in the context of insurance refers to

  1. Insurance companies increasing premiums for risky individuals.
  2. Policyholders take less risk due to insurance coverage.
  3. Policyholders misrepresent information to obtain lower premiums.
  4. Insurance companies deny coverage to high-risk individuals.

Answer: 2. Policyholders taking less risk due to insurance coverage.

Explanation:

Moral hazard in insurance occurs when individuals alter their. behavior or take more risks because they are protected against risk by insurance.

Question 9. Which of the following is an example of adverse selection in the used car market?

  1. Sellers provide detailed information about the car’s condition.
  2. Buyers select cars based on their preferences.
  3. Sellers selling high-quality cars at premium prices.
  4. Buyers are unsure about the true condition of the car.

Answer: 4. Buyers are unsure about the true condition of the car.

Explanation:

Adverse selection in the used car market occurs when buyers are unsure about the true condition of the car they are purchasing, as sellers may have more information about the car’s condition than buyers.

Question 10. How can markets mitigate the problem of incomplete information?

  1. By increasing government regulation and control.
  2. By limiting the availability of information to all market participants.
  3. Through transparency and disclosure of relevant information.
  4. By reducing competition among market participants.

Answer: 3. Through transparency and disclosure of relevant information.

Explanation:

Markets can mitigate the problem of incomplete information by promoting transparency and disclosure of relevant information to all market participants. This allows buyers and sellers to make more informed decisions.

Question 11. In economics, incomplete information refers to

  1. Situations where consumers have perfect knowledge about the goods and services they purchase
  2. Situations where producers have perfect knowledge about the costs of production
  3. Situations where there is uncertainty or asymmetry of information between buyers and sellers
  4. Situations where government regulations provide complete information to all market participants

Answer:  3. Situations where there is uncertainty or asymmetry of information between buyers and sellers

Question 12. Asymmetric information occurs when

  1. Buyers and sellers have equal knowledge about the quality of goods and services
  2. One party in a transaction has more information than the other
  3. Government agencies provide information to all market participants
  4. Market participants have perfect knowledge of market prices

Answer: 2. One party in a transaction has more information than the other

Question 13. Moral hazard refers to

  1. The risk that one party in a transaction will take advantage of the other’s lack of information
  2. The risk that market prices will change due to new information becoming available
  3. The risk that a party will deliberately take actions that increase the probability of a negative outcome ;
  4. The risk that one party will change the terms of a contract after it is agreed upon

Answer: 3. The risk that a party will deliberately take actions that increase the probability of a negative outcome

Question 14. Adverse selection occurs when

  1. Buyers and sellers have equal knowledge about the quality of goods and services
  2. One party in a transaction has more information about the product’s quality than the other
  3. The government provides complete information to all market participants
  4. Market participants have perfect knowledge of market prices

Answer: 2. One party in a transaction has more information about the product’s quality than the other

Question 15. In the context of insurance markets, adverse selection refers to

  1. The tendency for high-risk individuals to seek insurance coverage more than low-risk individuals
  2. The tendency for insurance companies to offer low premiums to attract more customers
  3. The presence of government regulations that ensure complete information for insurance buyers
  4. Equal access to insurance products for all individuals, regardless of their risk profile

Answer: 1. The tendency for high-risk individuals to seek insurance coverage more than low-risk individuals

Question 16. Which of the following is an example of adverse selection in the used car market?

  1. A seller providing complete information about a car’s history to potential buyers
  2. A buyer knows more about a car’s hidden defects than the seller
  3. A government agency regulating the prices of used cars
  4. All used cars being sold at the same price regardless of their condition

Answer: 2. A buyer knows more about a car’s hidden defects than the seller

Question 17. How can market participants mitigate the problem of incomplete information?

  1. By increasing government regulations and oversight
  2. By sharing more information
  3. By avoiding any form of insurance contracts
  4. By refusing to engage in any transactions

Answer: 2. By sharing more information

Question 18. The problem of adverse selection is most commonly observed in markets for

  1. Luxury goods and services
  2. Essential commodities and necessities
  3. Used cars and insurance products
  4. Government-subsidized products

Answer: 3. Used cars and insurance products

Asymmetric Information

Question 1. What does “asymmetric information” refer to in economics?

  1. A situation where buyers and sellers have the same level of information
  2. A situation where one party in a transaction has more information than the other
  3. A situation where prices are the same for all participants in the market
  4. A situation where there is no information available to make decisions

Answer: A situation where one party in a transaction has more information than the other

Explanation:

Asymmetric information in economics refers to a scenario where one party (either the buyer or the seller) involved in an economic transaction possesses more information than the other. This imbalance of information can lead to market inefficiencies and adverse outcomes.

Question 2. Which of the following is an example of asymmetric information in the used car market?

  1. All used cars have the same market price
  2. Buyers and sellers having access to the same car history reports
  3. A seller knows the true condition of a used car, but the buyer does not
  4. Buyers and sellers negotiating the price of used cars in an open market

Answer: 3. A seller knows the true condition of a used car, but the buyer does not

Explanation:

In the used car market, there is often asymmetric information because the seller usually has more information about the true condition of the car than the potential buyer. The buyer may not be aware of hidden issues or the car’s history, which can lead to adverse selection and potential problems for the buyer.

Question 3. What is adverse selection in the context of asymmetric information?

  1. A situation where sellers selectively disclose information to buyers
  2. A situation where both parties have complete and accurate information
  3. A situation where higher-quality goods are driven out of the market
  4. A situation where the presence of hidden information leads to undesirable outcomes

Answer:  4. A situation where the presence of hidden information leads to undesirable outcomes

Explanation:

Adverse selection occurs when one party in a transaction has more information than the other, leading to a market outcome that is unfavorable or undesirable due to hidden or asymmetric information. It can result in the presence of lower-quality goods or services dominating the market, driving out higher-quality options. .

Question 4. How can insurance companies address the problem of adverse selection?

  1. Offering lower premiums to high-risk individuals
  2. By providing more information to policyholders
  3. By avoiding selling insurance to high-risk individuals
  4. By pooling the risks of diverse individuals through underwriting

Answer: By pooling the risks of diverse individuals through underwriting

Explanation:

To address adverse selection, insurance companies pool the risks of a diverse group of individuals. By underwriting policies based on actuarial data and considering a mix of high-risk and low-risk policyholders, insurance companies can balance the risks and avoid being disproportionately exposed to adverse selection.

Question 5. Which concept refers to a situation where the presence of asymmetric information causes the deterioration of the quality of goods or services traded in the market?

  1. Moral hazard
  2. Market equilibrium
  3. Gresham’s Law
  4. Lemons problem

Answer: 4. Lemons problem

Explanation:

The “lemons problem” is a concept associated with asymmetric information, particularly in the context of used goods or services. It refers to the situation where the presence of asymmetric information causes the market to be dominated by lower-quality goods or services (lemons), driving out higher-quality options.

Question 6. What is asymmetric information?

  1. A situation where all parties involved in a transaction have equal access to information.
  2. A situation where one party in a transaction has more information than the other party.
  3. A situation where both parties in a transaction lack necessary information.
  4. A situation where the market information is not readily available to anyone.

Answer: 2. A situation where one party in a transaction has more information than the other party.

Explanation:

Asymmetric information refers to a situation in which one party involved in an economic transaction possesses more information than the other party. This
information asymmetry can lead to problems in the market and affect the outcome of the transaction.

Question 7. In the context of the used car market, what is adverse selection?

  1. The tendency of sellers to hide information about the car’s history.
  2. The tendency of buyers to pay more for high-quality used cars.
  3. The tendency of buyers to prefer new cars over used cars.
  4. The tendency of sellers to offer warranties on used cars.

Answer: 1. The tendency of sellers to hide information about the car’s history.

Explanation:

Adverse selection in the used car market refers to the tendency of sellers to hide or withhold information about the car’s true condition or. history, making it
difficult for buyers to distinguish between high-quality and low-quality used cars. This can lead to a market dominated by poor-quality used cars.

Question 8. Which of the following is an example of moral hazard?

  1. A person investing in a diversified portfolio to reduce risk.
  2. A person purchasing health insurance to cover medical expenses.
  3. A person taking more financial risks after purchasing comprehensive insurance.
  4. A person conducting market research to make an informed purchasing decision.

Answer: 3. A person taking more financial risks after purchasing comprehensive insurance.

Explanation:

Moral hazard occurs when one party changes their behavior in a way that increases the risk for the other party after a contract or agreement is made.Jn this case, the person takes more financial risks knowing that they are protected by comprehensive insurance, as the insurance company bears the financial burden in case of any adverse events.

Question 9. How does adverse selection impact the market for insurance?

  1. It leads to higher insurance premiums for everyone
  2. It encourages insurance companies to offer more coverage options.
  3. It results in a decrease in demand for insurance products.
  4. It reduces the profitability of insurance companies.

Answer: 1. It leads to higher insurance premiums for everyone.

Explanation:

Adverse selection in the insurance market occurs when higher-risk individuals are more likely to purchase insurance, while lower-risk individuals may avoid it. As a result, insurance companies face a pool of customers with a higher average risk, leading to higher claims and costs. To compensate for this increased risk, insurance companies often raise premiums for all customers

Question 10. Which of the following is a solution to the problem of adverse selection in insurance markets?

  1. Implementing price controls on insurance premiums
  2. Requiring individuals to purchase insurance
  3. Offering subsidies to insurance companies
  4. Pooling individuals with different risk levels

Answer: 4. Pooling individuals with different risk levels

Explanation:

Pooling individuals with different risk levels involves combining individuals with varying risk profiles in the same insurance pool. By doing. so, insurance companies can spread the risk more effectively, reducing the impact of adverse selection. This pooling allows insurance companies to offer more competitive and affordable premiums to a broader group of customers.

Government Intervention To Minimize Market Power

Question 1. Market power refers to

  1. The ability of the government to control market prices.
  2. The ability of a single firm to influence market prices and output.
  3. The government’s ability to regulate market competition.
  4. The ability of consumers to make informed purchasing decisions.

Answer: 2. The ability of a single firm to influence market prices and output.

Explanation:

Market power refers to the ability of a single firm or a group of firms to influence market prices and output by acting as a price maker rather than a price taker.

Question 2. Which of the following is a consequence of excessive market power?

  1. Increased competition and lower prices for consumers.
  2. Optimal allocation of resources in the market.
  3. Reduced consumer choices and higher prices.
  4. Elimination of government regulations.

Answer: 3. Reduced consumer choices and higher prices.

Explanation:

Excessive market power can lead to reduced consumer choices and higher prices as firms with significant market power may exploit their position to limit competition and charge higher prices.

Question 3. Antitrust laws are designed to

  1. Protect firms with dominant market positions from competition.
  2. Encourage collusion among competing firms.
  3. Promote mergers and acquisitions in the market.
  4. Prevent monopolistic practices and promote competition.

Answer: 4. Prevent monopolistic practices and promote competition.

Explanation:

Antitrust laws are designed to prevent monopolistic practices, such as price fixing and collusion, and promote competition in the market to protect consumer welfare.

Question 4. A natural monopoly occurs when

  1. A single firm dominates the market due to barriers to entry.
  2. There is perfect competition among multiple firms in the market.
  3. The government owns and operates all industries in the economy.
  4. Market power is evenly distributed among all firms in the industry.

Answer: A single firm dominates the market due to barriers to entry.

Explanation:

A natural monopoly occurs when a single firm can efficiently serve the entire market due to economies of scale or other barriers to entry, making it impractical for other firms to enter and compete.

Question 5. Government intervention to minimize market power can include

  1. Imposing price floors to protect producers.
  2. Providing subsidies to encourage higher production.
  3. Breaking up monopolies or regulating their behavior.
  4. Implementing import tariffs to promote domestic industries.

Answer: 3. Breaking up monopolies or regulating their behavior.

Explanation:

Government intervention to minimize market power can include breaking up monopolies into smaller firms or regulating the behavior of dominant firms to ensure fair competition and protect consumers.

Question 6. Market power refers to the ability of a firm or a group of firms to

  1. Minimize production costs and maximize profits.
  2. Influence market prices and control the quantity of goods produced.
  3. Compete fairly in the market and offer high-quality products.
  4. Participate in international trade and expand their market share.

Answer: Influence market prices and control the quantity of goods produced.

Explanation:

Market power refers to the ability of a firm or a group of firms to influence market prices and control the number of goods produced in the market.

Question 7. Which of the following is a potential consequence of excessive market power?

  1. Increased competition and lower prices for consumers.
  2. Higher quality products and improved customer service.
  3. Limited choices and higher prices for consumers.
  4. Increased innovation and technological advancements.

Answer: 3. Limited choices and higher prices for consumers.

Explanation:

Excessive market power can lead to limited choices for consumers and higher prices since dominant firms may have the ability to set prices without facing significant competition.

Question 8. Government intervention to minimize market power can include

  1. Providing subsidies to support monopolistic firms.
  2. Enforcing antitrust laws to promote competition.
  3. Imposing price controls to regulate the market.
  4. Discouraging new firms from entering the market.

Answer: 2. Enforcing antitrust laws to promote competition.

Explanation:

Government intervention to minimize market power often involves enforcing antitrust laws to prevent monopolies and promote competition in the market.

Question 9. A natural monopoly occurs when

  1. There is only one firm in the market with significant market power.
  2. The government regulates the prices and operations of all firms.
  3. Multiple firms compete in the market without any dominance.
  4. Economies of scale make it more efficient for one firm to serve the entire market.

Answer: 4. Economies of scale make it more efficient for one firm to serve the entire market.

Explanation:

A natural monopoly occurs when economies of scale are such that it is more efficient for one firm to serve the entire market, leading to a single dominant firm in
the industry.

Question 10. How can the government promote competition to minimize market power?

  1. By granting exclusive rights to firms for certain products.
  2. By providing subsidies to dominant firms to expand their production.
  3. By removing barriers to entry and encouraging new competitors.
  4. By imposing price floors to protect producers from low prices.

Answer: 3. By removing barriers to entry and encouraging new competitors.

Explanation:

The government can promote competition and minimize market power by removing barriers to entry, encouraging new competitors to enter the market, and ensuring a
level playing field for all firms.

Government Intervention To Correct Externalities

Question 1. Externalities in the market refer to

  1. The influence of government policies on market outcomes.
  2. The impact of international trade on domestic industries.
  3. The spillover effects of market activities on third parties.
  4. The fluctuations in market prices are due to supply and demand.

Answer: 3. The spillover effects of market activities on third parties.

Explanation:

Externalities in the market refer to the spillover effects of market activities, where the actions of buyers or sellers have unintended consequences on third parties who are not directly involved in the • transaction. ‘

Question 2. A negative externality occurs when

  1. The production of a good benefits third parties.
  2. The production of a good imposes costs on third parties.
  3. The government imposes taxes on goods and services.
  4. The market is in equilibrium without any distortions.

Answer: 1. The production of a good imposes costs on third parties.

Explanation:

A negative externality occurs when the production or consumption of a good imposes costs on third parties who are not involved in the transaction.

Question 3. Which of the following is a government intervention to correct negative externalities?

  1. Subsidizing the production of goods with negative externalities.
  2. Imposing taxes on goods with negative externalities.
  3. Restricting the production of goods with positive externalities.
  4. Providing direct financial support to firms.

Answer: 2. Imposing taxes on goods with negative externalities.

Explanation:

To correct negative externalities, the government can impose taxes on goods or activities that generate negative spillover effects. This is known as a corrective or Pigovian tax.

Question 4. Positive externalities occur when

  1. The production of a good benefits third parties.
  2. The production of a good imposes costs on third parties.
  3. The government intervenes in the market.
  4. There is overproduction. of goods in the market.

Answer: 2. The production of a good benefits third parties.

Explanation:

Positive externalities occur when the production or consumption of a good benefits third parties who are not directly involved in the transaction.

Question 5. Which of the following is a government intervention to correct positive externalities?

  1. Subsidizing the production of goods with positive externalities.
  2. Imposing taxes on goods with positive externalities.
  3. Imposing price ceilings on goods with positive externalities.
  4. Removing government regulations on production.

Answer: 1. Subsidizing the production of goods with positive externalities.

Explanation:

To correct positive externalities, the government can provide subsidies to goods or activities that generate positive spillover effects, encouraging their production or consumption.

Question 6. Negative externalities occur when

  1. The production of a good leads to a higher demand for other goods.
  2. The consumption of a good benefits other individuals in society.
  3. Economic activities impose costs on third parties.
  4. There is an oversupply of goods in the market.

Answer: 3. Economic activities impose costs on third parties.

Explanation:

Negative externalities occur when economic activities impose costs on third parties, beyond what is accounted for in the market price.

Question 7. Which of the following is a potential solution for correcting negative externalities?

  1. Providing subsidies to the firms generates negative externalities.
  2. Implementing price controls to regulate the market.
  3. Enforcing property rights and allowing lawsuits against polluters.
  4. Imposing higher taxes on consumers of the goods with negative externalities.

Answer: 3. Enforcing property rights and allowing lawsuits against polluters.

Explanation:

Enforcing property rights and allowing lawsuits against polluters can be a potential solution to correct negative externalities by making polluters accountable for the harm caused.

Question 8. Positive externalities occur when

  1. The production of a good leads to higher prices in the market.
  2. Economic activities benefit third parties without compensation.
  3. There is a surplus of goods in the market.
  4. There is an undersupply of goods in the market.

Answer: 2. Economic activities benefit third parties without compensation.

Explanation:

Positive externalities occur when economic activities benefit third parties without those parties being compensated for it.

Question 9. Which of the following is a government intervention to encourage positive externalities?

  1. Imposing taxes on the producers of goods with positive externalities.
  2. Providing subsidies to the producers of goods with positive externalities.
  3. Enforcing price ceilings to reduce prices of goods with positive externalities.
  4. Discouraging the consumption of goods with positive externalities.

Answer: 2. Providing subsidies to the producers of goods with positive externalities.

Explanation:

Providing subsidies to the producers of goods with positive externalities can be a government intervention to encourage the production and consumption of such goods.

Question 10.  Externalities refer to

  1. The benefits or costs of production that spill over to affect third parties
  2. The government’s intervention in the market to control prices
  3. The equal distribution of income and wealth in society
  4. The fluctuations in supply and demand in the market

Answer: 1. The benefits or costs of production that spill over to affect third parties

Question 11. Negative externalities occur when

  1. The government imposes taxes to fund public goods “
  2. The costs of production are borne by producers alone
  3. The benefits of production are enjoyed by consumers alone
  4. The costs of production are imposed on third parties not involved in the transaction

Answer: 4. The costs of production are imposed on third parties not involved in the transaction

Question 12. Which of the following is an example of a negative externality?

  1. A company providing scholarships to local students
  2. The construction of a new park in the neighborhood
  3. Pollution from a factory affecting nearby residents
  4. Government subsidies to support renewable energy.

Answer:  3. Government subsidies to support renewable energy.

Question 13. To correct negative externalities, the government can use

  1. Subsidies to encourage more production of goods with negative externalities
  2. Taxes to discourage the production of goods with negative externalities.
  3. Import tariffs to protect domestic industries
  4. Price controls to regulate the prices of goods with negative externalities

Answer: 2. Taxes to discourage the production of goods with negative externalities.

Question 14. Positive externalities occur when

  1. The government provides subsidies to firms to promote production
  2. The costs of production are imposed on third parties not involved in the transaction
  3. The benefits of production are enjoyed by producers alone
  4. The benefits of production spill over to benefit third parties not involved in the transaction

Answer: 4. The benefits of production spill over to benefit third parties not involved in the transaction

Question 15. Which of the following is an example of a positive externality?

  1. A company selling a product at a higher price than its competitors
  2. A vaccination program reducing the spread of infectious diseases in a community
  3. A government imposing high tariffs on imported goods
  4. A company causing pollution that affects the health of nearby residents

Answer: 2. A vaccination program reducing the spread of infectious diseases in a community

Question 16. To correct positive externalities, the government can use

  1. Subsidies to discourage the production of goods with positive. externalities ‘
  2. Taxes to reduce consumption of goods with positive externalities
  3. Regulations to limit the benefits of production to certain individuals
  4. Subsidies to encourage the production of goods with positive externalities

Answer: 4. Subsidies to encourage the production of goods with positive externalities

Question 17. The main goal of government intervention to correct externalities is to

  1. Eliminate all externalities from the market
  2. Reduce the efficiency of market transactions
  3. Internalize external costs or benefits to achieve a more optimal outcome
  4. Limit the role of government in economic activities

Answer: 3. Internalize external costs or benefits to achieve a more optimal outcome

Government Intervention In The Case Of Merit Goods

Question 1. Merit goods are goods that

  1. Have high market demand and limited supply.
  2. Are provided by the government without any cost to consumers.
  3. Are considered to have positive externalities and are underprovided by the market.
  4. Are characterized by rivalry in consumption and excludability.

Answer: 2. Are considered to have positive externalities and are underprovided by the market.

Explanation:

Merit goods are goods that are considered to have positive externalities, meaning they benefit society beyond the direct benefits to consumers, and are underprovided by the market.

Question 2. Which of the following is an example of a merit good?

  1. Fast food and soft drinks.
  2. Private luxury cars.
  3. Education and vaccinations.
  4. High-end fashion products.

Answer: 3. Education and vaccinations.

Explanation:

Education and vaccinations are examples of merit goods because they provide benefits not only to the individuals receiving them but also to society as a whole in terms of better health and increased productivity.

Question 3. Why might merit goods be underprovided by the market?

  1. Because they have low demand and high supply.
  2. Because they are often inferior in quality to other goods.
  3. Because producers find it unprofitable to supply them.
  4. Because consumers are not aware of their benefits.

Answer: 3. Because producers find it unprofitable to supply them. Explanation:

Merit goods might be underprovided by the market because producers may find it unprofitable to supply them due to the positive externalities they generate, which are not directly reflected in their market prices.

Question 4. How can the government intervene to ensure adequate provision of merit goods?

  1. By imposing price controls to keep prices low.
  2. By reducing taxes on the production of merit goods.
  3. By providing subsidies to producers of merit goods.
  4. By reducing government expenditure on other sectors.

Answer: 3. By providing subsidies to producers of merit goods.

Explanation:

The government can intervene to ensure adequate provision of merit goods by providing subsidies to producers, which can incentivize them to supply these goods despite the positive externalities involved.

Question 5. The purpose of government intervention in the case of merit goods is to

  1. Increase consumer choices in the market.
  2. Maximize government revenue from taxes.
  3. Correct market failures and ensure social welfare.
  4. Encourage competition among producers.

Answer: 3. Correct market failures and ensure social welfare.

Explanation:

Government intervention in the case of merit goods aims to correct market failures, such as the underprovision of goods with positive externalities, and ensure the well-being of society as a whole

Question 6. Merit goods are goods that

  1. Are produced by government-owned firms.
  2. Are provided by private firms but subsidized by the government.
  3. Have positive externalities and are underprovided in the free market.
  4. Have negative externalities and are overproduced in the free market.

Answer: 3. Have positive externalities and are underprovided in the free market.

Explanation:

Merit goods are goods that have positive externalities, meaning their consumption generates benefits for society beyond what is considered in the market. They are often underprovided in the free market because individuals may not fully consider these external benefits when making consumption decisions.

Question 7. Which of the following is an example of a merit good?

  1. Cigarettes and alcoholic beverages.
  2. Fast food and sugary beverages.
  3. Education and vaccinations. .
  4. Luxury cars and high-end fashion.

Answer: 3. Education and vaccinations.

Explanation:

Education and vaccinations are examples of merit goods as they have positive externalities. Providing education and vaccinations not only benefits individuals directly but also has broader societal benefits in terms of increased productivity and reduced spread of diseases.

Question 8. Government intervention to promote merit goods can include

  1. Imposing higher taxes on the consumption of merit goods.
  2. Subsidizing the production of merit goods.
  3. Implementing price controls to regulate the prices of merit goods.
  4. Promoting advertisements for luxury goods.

Answer: 2. Subsidizing the production of merit goods.

Explanation:

Government intervention to promote merit goods can include subsidizing the production of these goods to encourage their availability and consumption.

Question 9. Why are merit goods often underprovided in the free market?

  1. Because they are produced by government-owned firms.
  2. Because private firms find them unprofitable to produce.
  3. Because consumers do not value their positive externalities.
  4. Because they are subject to price ceilings.

Answer: 2. Because private firms find them unprofitable to produce.

Explanation: 

Merit goods are often underprovided in the free market because private firms may find them unprofitable to produce due to the inability to fully capture the societal benefits (positive externalities) in their revenues.

Question 10. The government’s intervention in the case of merit goods is primarily aimed at

  1. Restricting the consumption of these goods.
  2. Ensuring equitable distribution of these goods.
  3. Encouraging the consumption of these goods.
  4. Eliminating the production of these goods.

Answer: 3. Encouraging the consumption of these goods.

Explanation:

The government’s intervention in the case of merit goods is primarily aimed at encouraging the consumption of these goods to ensure that their positive externalities are fully realized in society.

Question 11. Merit goods are characterized by

  1. Being produced and provided by private companies only
  2. High prices and limited accessibility for all consumers
  3. Having positive externalities and being under-consumed in the market
  4. Being rivalrous in consumption and subject to market failures

Answer: 3. Having positive externalities and being under-consumed in the market

Question 12. Which of the following is an example of a merit good?

  1. Luxury cars with high price tags
  2. Fast food items with excessive sugar and fat content
  3. Public education and healthcare services
  4. Designer clothing and accessories

Answer: 3. Public education and healthcare services

Question 13. Merit goods are typically

  1. Overprovided in the market due to high consumer demand
  2. Subject to competitive market forces and price fluctuations
  3. Underprovided in the market due to positive externalities
  4. Provided by private companies with no government involvement

Answer: 3. Underprovided in the market due to positive externalities

Question 14. To encourage the consumption of merit goods, the government can

  1. Impose taxes to reduce consumption and limit negative externalities
  2. Provide subsidies to consumers to lower the prices of these goods
  3. Deregulate the market to allow for greater competition
  4. Implement price controls to keep the prices stable

Answer: 2. Provide subsidies to consumers to lower the prices of these goods

Question 15. The primary goal of government intervention in the case of merit goods is to

  1. Limit consumer choice and promote government-controlled markets
  2. Increase the prices of these goods to generate more government revenue
  3. Ensure that consumers have access to these goods despite their positive externalities
  4. Eliminate the production of merit goods to reduce market inefficiencies

Answer: 3. Ensure that consumers have access to these goods despite their positive externalities

Question 16. One of the challenges of government intervention in providing merit goods is

  1. Overconsumption and excessive demand for these goods
  2. The difficulty in identifying which goods have positive externalities
  3. The lack of interest from private companies to produce merit goods
  4. The need to impose high taxes on consumers to fund the provision of these goods

Answer:  2. The difficulty in identifying which goods have positive externalities

Question 17. In the case of merit goods, the government’s role is to

  1. Completely replace the private sector in providing these goods
  2. Let the market forces determine their prices and availability
  3. Encourage private companies to overproduce these goods for profit
  4. Correct market failures by ensuring adequate provision of these goods

Answer: 4. Correct market failures by ensuring adequate provision of these goods

Question 18. Which of the following is a potential consequence of inadequate provision of merit goods in society?

  1. Increased consumption of harmful goods with negative externalities
  2. Lower government expenditures and reduced budget deficits
  3. Higher prices of merit goods due to excessive demand
  4. A more efficient allocation of resources in the market

Answer: 1. Increased consumption of harmful goods with negative externalities

Government Intervention In The Case Of Demerit Goods

Question 1. Demerit goods are goods that

  1. Have positive externalities and are underprovided in the free market.
  2. Have negative externalities and are overproduced in the free market.
  3. Are produced by government-owned firms.
  4. Are provided by private firms but subsidized by the government.

Answer: Have negative externalities and are overproduced in the free market.

Explanation:

Demerit goods are goods that have negative externalities, meaning their consumption imposes costs on society beyond what is considered in the market. They are often overproduced in the free market because individuals may not fully consider these external costs when making consumption decisions.

Question 2. Which of the following is an example of a demerit good?

  1. Education and vaccinations.
  2. Fast food and sugary beverages.
  3. Renewable energy sources.
  4. Public transportation services.

Answer: 2. Fast food and sugary beverages.

Explanation:

Fast food and sugary beverages are examples of demerit goods as their consumption can have negative externalities, such as health issues and increased healthcare costs.

Question 3. Government intervention to discourage the consumption of demerit goods can include:

  1. Subsidizing the production of demerit goods.
  2. Implementing price controls to regulate the prices of demerit goods.
  3. Enforcing property rights for demerit goods.
  4. Imposing higher taxes on the consumption of demerit goods. .

Answer: 4. Imposing higher taxes on the consumption of demerit goods.

Explanation:

Government intervention to discourage the consumption of demerit goods can include imposing higher taxes on the consumption of these goods, known as “sin taxes.” This aims to increase the price of demerit goods, reducing their consumption and mitigating negative externalities.

Question 4. Why are demerit goods often overproduced in the free market?

  1. Because they are produced by government-owned firms.
  2. Because private firms find them profitable to produce.
  3. Because consumers fully consider their negative externalities.
  4. Because they are subject to price floors.

Answer: 2. Because private firms find them profitable to produce.

Explanation:

Demerit goods are often overproduced in the free market because private firms may find them profitable to produce due to consumers not fully considering the negative externalities associated with these goods.

Question 5. The government’s intervention in the case of demerit goods is primarily aimed at

  1. Restricting the consumption of these goods.
  2. Ensuring equitable distribution of these goods.
  3. Encouraging the consumption of these goods.
  4. Eliminating the production of these goods.

Answer: 1. Restricting the consumption of these goods.

Explanation:

The government’s intervention in the case of demerit goods is primarily aimed at restricting the consumption of these goods to mitigate the negative externalities and protect public health and well-being.

Question 6. Demerit goods are characterized by

  1. Having positive externalities and being under-consumed in the market
  2. High prices and limited accessibility for all consumers
  3. Having negative externalities and being over-consumed in the market
  4. Being rivalrous in consumption and subject to market failures

Answer: 3. Being rivalrous in consumption and subject to market failures

Question 7. Which of the following is an example of a demerit good?

  1. Organic fruits and vegetables
  2. Cigarettes and tobacco products
  3. Public education and healthcare services
  4. Renewable energy sources.

Answer: 2. Cigarettes and tobacco products

Question 8. Demerit goods are typically

  1. Overprovided in the market due to high consumer demand
  2. Subject to competitive market forces and price fluctuations
  3. Underprovided in the market due to negative externalities
  4. Provided by private companies with no government involvement

Answer: 1. Overprovided in the market due to high consumer demand

Question 9. To discourage the consumption of demerit goods, the government can

  1. Impose taxes to reduce consumption and internalize negative externalities
  2. Provide subsidies to consumers to lower the prices of these goods
  3. Deregulate the market to allow for greater competition
  4. Implement price controls to keep the prices stable

Answer: 1. Impose taxes to reduce consumption and internalize negative externalities

Question 10. The primary goal of government intervention in the case of demerit goods is to

  1. Limit consumer choice and promote government-controlled markets
  2. Increase the prices of these goods to generate more government revenue
  3. Reduce the consumption of these goods due to their negative externalities
  4. Encourage the production of demerit goods for profit

Answer: 3. Reduce the consumption of these goods due to their negative externalities

Question 11. One of the challenges of government intervention in discouraging demerit goods is

  1. Overconsumption and excessive demand for these goods
  2. The difficulty in identifying which goods have negative externalities
  3. The lack of interest from private companies to produce demerit goods
  4. The need to provide subsidies to consumers to increase consumption

Answer: 2. The difficulty in identifying which goods have negative externalities

Question 12. In the case of demerit goods, the government’s role is to

  1. Completely replace the private sector in providing these goods
  2. Let the market forces determine their prices and availability
  3. Encourage private companies to overproduce these goods for profit
  4. Correct market failures by discouraging the consumption of these goods

Answer: 4. Correct market failures by discouraging the consumption of these goods

Question 13. Which of the following is a potential consequence of excessive consumption of demerit goods in society?

  1. Reduced government expenditures and increased budget surplus
  2. Higher healthcare costs and negative health outcomes
  3. Lower prices of demerit goods due to excessive demand
  4. Improved allocation of resources in the market

Answer: 2. Higher healthcare costs and negative health outcomes

Government Intervention In The Case Of Public Goods

Question 1. Public goods are characterized by

  1. Excludability and rivalry in consumption.
  2. Non-excludability and rivalry in consumption.
  3. Excludability and non-rivalry in consumption.
  4. Non-excludability and non-rivalry in consumption.

Answer: 4. Non-excludability and non-rivalry in consumption.

Explanation:

Public goods are non-excludable goods, meaning individuals cannot be excluded from using them, and non-rivalrous, meaning one person’s use does not reduce the availability for others.

Question 2. Which of the following is a key challenge in the provision of public goods?

  1. Free-rider problem.
  2. Price fluctuations in the market.
  3. Excessive competition among producers.
  4. Lack of demand from consumers.

Answer: 1. Free-rider problem.

Explanation:

The free-rider problem is a key challenge in the provision of public goods, where individuals can enjoy the benefits of a public good without contributing to its provision.

Question 3. Government intervention in the provision of public goods can involve

  1. Imposing high taxes on consumers who use public goods.
  2. Restricting access to public goods to a selected group of individuals.
  3. Privatizing the production and distribution of public goods.
  4. Financing the provision of public goods through taxes and government spending.

Answer: 4. Financing the provision of public goods through taxes and government spending.

Explanation:

Government intervention in the provision of public goods often involves financing these goods through taxes and government spending since private firms may find it unprofitable to produce public goods.

Question 4. Which of the following is an example of a public good that is typically provided by the government?

  1. Movie tickets.
  2. Cable TV subscriptions.
  3. National defense.
  4. Smartphones.

Answer: 3. National defense.

Explanation:

National defense is an example of a public good that is typically provided by the government, as it is non-excludable and non-rivalrous in consumption.

Question 5. The concept of “crowding out” refers to

  1. The phenomenon where the demand for public goods exceeds the government’s ability to provide them.
  2. Government spending on public goods leads to reduced private-sector investment.
  3. The government’s attempt to exclude certain individuals from accessing public goods.
  4. The competition between private firms in providing public goods.

Answer: 2. Government spending on public goods leads to reduced private-sector investment.

Explanation:

The concept of “crowding out” refers to government spending on public goods leading to reduced private-sector investment because of increased government borrowing and higher interest rates.

Question 6. Why are public goods often underprovided in the free market?

  1. Because they are produced by government-owned firms.
  2. Because private firms find them unprofitable to produce.
  3. Because consumers are fully aware of their positive externalities.
  4. Because they are subject to price ceilings.

Answer: 2. Because private firms find them unprofitable to produce.

Explanation:

Public goods are often underprovided in the free market because private firms may find them unprofitable to produce due to the inability to fully capture the societal benefits (positive externalities) in their revenues.

Question 7. Government intervention to provide public goods can include

  1. Imposing taxes on consumers to fund their production.
  2. Subsidizing private firms to produce public goods.
  3. Implementing price controls to regulate the prices of public goods,
  4. Encouraging consumers to purchase public goods.

Answer: 2. Subsidizing private firms to produce public goods.

Explanation:

Government intervention to provide public goods can include subsidizing private firms or organizations to produce public goods, ensuring their provision for society.

Question 8. Which of the following is an example of a public good?

  1. Education is provided by a private school.
  2. Cable TV subscription with different channels.
  3. National defense is provided by the government.
  4. Exclusive access to a members-only online forum.

Answer: 3. National defense provided by the government.

Explanation:

The national defense provided by the government is an example of a public good because it is non-excludable (cannot exclude citizens from protection) and non-rivalrous (protecting one citizen does not diminish the protection of others).

Question 9. How can the government promote the provision of public goods?

  1. By granting exclusive rights to firms for certain public goods.
  2. By providing subsidies to private firms to limit public goods production.
  3. By increasing taxes on individuals to reduce public goods consumption.
  4. By directly funding the production of public goods.

Answer: 4. By directly funding the production of public goods.

Explanation:

The government can promote the provision of public goods by directly funding their production or providing funds to organizations or entities that produce public goods for the benefit of society.

Question 10. Public goods are characterized by

  1. Rivalry in consumption and exclusion of non-payers
  2. Rivalry in consumption and non-exclusion of non-payers
  3. Non-rivalry in consumption and exclusion of non-payers
  4. Non-rivalry in consumption and non-exclusion of non-payers

Answer: 4. Non-rivalry in consumption and non-exclusion of non-payers

Question 11. Which of the following is an example of a public good?

  1. A private toll road with restricted access
  2. National defense and military protection
  3. A company providing exclusive memberships
  4. Pollution from a factory affects nearby residents.

Answer: 2. National defense and military protection

Question 12. Public goods are typically

  1. Overprovided in the market due to high consumer demand
  2. Subject to competitive market forces and price fluctuations
  3. Underprovided in the market due to the free-rider problem
  4. Provided by private companies with no government involvement

Answer: 3. Underprovided in the market due to the free-rider problem

Question 13. The free-rider problem refers to

  1. Consumers demanding more goods than producers can supply
  2. Firms in the market charge excessively high prices for their products.
  3. People benefiting from a public good without contributing to its provision
  4. Government intervention causing market inefficiencies

Answer: 3. People benefiting from a public good without contributing to its provision

Question 14. To ensure the provision of public goods, the government can

  1. Impose taxes to fund the production of public goods
  2. Provide subsidies to private firms to produce public goods
  3. Deregulate the market to allow for greater competition
  4. Implement price controls to regulate the prices of public goods

Answer: 1. Impose taxes to fund the production of public goods

Question 15.  Which of the following is NOT a characteristic of public goods?

  1. Non-rivalry in consumption
  2. Non-exclusion of non-payers,
  3. Positive externalities associated with consumption
  4. Under-consumption in the market

Answer: 3. Positive externalities associated with consumption

Question 16. The primary goal of government intervention in the case of public goods is to

  1. Limit consumer choice and control the production of public goods
  2. Increase prices of public goods to generate more government revenue
  3. Ensure the provision of public goods despite the free-rider problem
  4. Encourage private companies to produce public goods for profit

Answer: 3. Ensure the provision of public goods despite the free-rider problem

Question 17. Which of the following is a potential consequence of the under-provision of public goods in society?

  1. Excessive government spending and budget deficit
  2. Lower taxes and reduced government expenditure
  3. Lack of access to essential services and infrastructure
  4. Inefficient allocation of resources in the market

Answer: 3. Lack of access to essential services and infrastructure

Price Intervention Non-Market Pricing

Question 1. Non-market pricing refers to

  1. The setting of prices based on supply and demand in the market.
  2. The government’s intervention to control prices in the market.
  3. The use of prices as a mechanism to allocate resources efficiently.
  4. The setting of prices by the government outside the regular market forces.

Answer: 1. The setting of prices by the government outside the regular market forces.

Explanation:

Non-market pricing refers to the setting of prices by the government or other authorities outside the regular market forces of supply and demand.

Question 2. Which of the following is an example of non-market pricing?

  1. A competitive market where prices are determined by supply and demand.
  2. Government-controlled price ceilings on rent in certain areas.
  3. Pricing strategy based on product differentiation.
  4. Dynamic pricing is used by online retailers.

Answer: 2. Government-controlled price ceilings on rent in certain areas.

Explanation:

Government-controlled price ceilings on rent in certain areas are an example of non-market pricing as the government intervenes to set the maximum price that landlords can charge for rent.

Question 3. What is the primary objective of non-market pricing by the government?

  1. To maximize profits for private firms.
  2. To encourage competition among producers.
  3. To ensure price stability and affordability for consumers.
  4. To eliminate the role of prices in the economy.

Answer: 2. To ensure price stability and affordability for consumers.

Explanation:

The primary objective of non-market pricing by the government is to ensure price stability and affordability for consumers, especially in essential goods and services.

Question 4. Price floors imposed by the government result in

  1. Higher prices and excess supply in the market.
  2. Lower prices and excess demand in the market.
  3. Higher prices and shortage of goods in the market.
  4. Lower prices and increased competition among producers.

Answer: 1. Higher prices and shortage of goods in the market.

Explanation:

Price floors imposed by the government set a minimum price level, which leads to higher prices and a potential shortage of goods in the market as the quantity demanded may be lower than the quantity supplied at the floor price.

Question 5. Non-market pricing is often used by the government to

  1. Encourage competition and innovation among firms.
  2. Allow market forces to determine prices freely.
  3. Correct market failures and ensure equitable distribution.
  4. Eliminate the role of prices in resource allocation.

Answer: 3. Correct market failures and ensure equitable distribution.

Explanation:

Non-market pricing is often used by the government to correct market failures and ensure equitable distribution of goods and services, especially in cases where the the market may not allocate resources efficiently or fairly.

Question 6. Non-market pricing is often used to address

  1. Market failures and externalities.
  2. Competitive pricing in the market.
  3. Demand and supply fluctuations.
  4. Price discrimination by businesses.

Answer: 1. Market failures and externalities.

Explanation:

Non-market pricing is often used to address market failures and externalities by regulating prices to correct inefficiencies in the market.

Question 7. What is the primary purpose of non-market pricing?

  1. To increase profits for businesses.
  2. To promote competition among firms.
  3. To allocate resources most efficiently.
  4. To reduce government control over the economy.

Answer: 3. To allocate resources most efficiently.

Explanation:

The primary purpose of non-market pricing is to allocate resources most efficiently, taking into account external considerations and correcting market failures.

Question 8. Non-market pricing may lead to

  1. Greater market efficiency and consumer welfare.
  2. Lower production and decreased consumer choices.
  3. Increased competition among firms.
  4. Higher prices due to supply shortages.

Answer: 2. Lower production and decreased consumer choices.

Explanation:

Non-market pricing can sometimes lead to lower production and decreased consumer choices, as it may affect the incentives for businesses to produce certain goods or services.

Question 9. Non-market pricing refers to

  1. The pricing mechanism determined by supply and demand forces in a market
  2. The setting of prices by the government or other authorities outside • of the market forces
  3. The practice of firms colluding to fix prices in a competitive market
  4. The use of price controls to regulate market prices.

Answer: 2. The setting of prices by the government or other authorities outside • of the market forces

Question 10. Which of the following is an example of non-market pricing?

  1. A company setting its product price based on market demand and production costs
  2. The government capping the price of essential goods to control inflation
  3. A competitive market where prices are determined solely by supply and demand
  4. A company engaging in predatory pricing to drive competitors out of the market

Answer: 2. The government capping the price of essential goods to control inflation

Question 11. Price controls are government interventions that

  1. Allow firms to set prices freely to maximize profits
  2. Restrict the entry of new firms in the market to maintain price stability
  3. Fix maximum or minimum prices for certain goods and services
  4. Prohibit firms from engaging in price discrimination

Answer: 3. Fix maximum or minimum prices for certain goods and services

Question 12. Which of the following is an example of a price ceiling?

  1. The government sets a minimum price for agricultural products to support farmers
  2. A city government caps the rent that landlords can charge for residential properties
  3. A company raises its product price to increase profit margins
  4. The government allows free-market forces to determine the price of luxury goods

Answer: 2. Acity government caps the rent that landlords can charge for residential properties

Question 13. Price floors are designed to

  1. Prevent price discrimination in the market
  2. Stabilize prices during periods of high inflation
  3. Encourage competition among firms to lower prices
  4. Set a minimum price for certain goods to support producers

Answer: 4. Set a minimum price for certain goods to support producers

Question 14. The primary purpose of implementing non-market pricing measures like price controls is to

  1. Allow firms to maximize profits by freely setting prices
  2. Achieve an equitable distribution of income and wealth in society
  3. Increase government revenue by taxing consumer purchases
  4. Eliminate all market inefficiencies and imperfections

Answer: 2. Achieve an equitable distribution of income and wealth in society

Question 15. One of the potential drawbacks of price controls is

  1. The increased likelihood of price gouging by firms
  2. The potential for excessive competition and price wars
  3. The distortion of market signals and reduced incentives for producers
  4. The elimination of all price fluctuations in the market

Answer: 3. The distortion of market signals and reduced incentives for producers

Question 16. Non-market pricing measures are often implemented when

  1. The market is experiencing perfect competition and efficient price determination
  2. There is a need to correct externalities and market failures
  3. The government seeks to maximize profits for firms
  4. Consumers demand lower prices for goods and services

Answer: 2. There is a need to correct externalities and market failures

Government Intervention For Correcting Information Failure

Question 1. Information failure occurs when

  1. The government intervenes in the market to regulate prices.
  2. Consumers have perfect knowledge about the quality and price of goods.
  3. Market participants have unequal access to information.
  4. There is an oversupply of goods in the market.

Answer: 3. Market participants have unequal access to information.

Explanation:

Information failure occurs when some market participants have more or better information than others, leading to an information asymmetry.

Question 2. Which of the following is a potential consequence of information failure?

  1. Increased competition and lower prices for consumers.
  2. Higher quality products and improved customer service.
  3. Limited choices and higher prices for consumers.
  4. Increased innovation and technological advancements.

Answer: 3. Limited choices and higher prices for consumers.

Explanation:

Information failure can lead to limited choices for consumers and higher prices since some participants may have more information, giving them an advantage in the market.

Question 3. Government intervention to correct information failure can include

  1. Imposing price controls to regulate the market.
  2. Limiting the availability of information to all market participants.
  3. Enforcing property rights and allowing lawsuits for misrepresentation.
  4. Providing subsidies to firms with more information.

Answer: 3. Enforcing property rights and allowing lawsuits for misrepresentation.

Explanation:

Government intervention to correct information failure can include enforcing property rights and allowing individuals to pursue legal action for misrepresentation or fraud.

Question 4. How can the government promote transparency and reduce information failure?

  1. By granting exclusive rights to firms for certain products.
  2. By restricting the flow of information to protect businesses.
  3. By enforcing regulations that require firms to disclose relevant information.
  4. By reducing competition among market participants.

Answer: 3. By enforcing regulations that require firms to disclose relevant information.

Explanation:

The government can promote transparency and reduce information failure by enforcing regulations that require firms to disclose relevant information to consumers, investors, or other market participants.

Question 5. Why is correcting information failure important in a market economy?

  1. To limit government interference in the market.
  2. To protect businesses from competition.
  3. To ensure that markets function efficiently and fairly.
  4. To increase profits for firms.

Answer: 3. To ensure that markets function efficiently and fairly.

Explanation:

Correcting information failure is important in a market economy to ensure that markets operate efficiently and fairly and that consumers can make informed choices.

Question 6. Which of the following is an example of government intervention to correct information failure?

  1. Requiring businesses to disclose nutritional information on food labels.
  2. Allowing businesses to keep their product information confidential.
  3. Imposing price ceilings to control inflation.
  4. Allowing businesses to mislead consumers with false advertisements.

Answer: 1. Requiring businesses to disclose nutritional information on food labels.

Explanation:

Requiring businesses to disclose nutritional information on food labels is an example of government intervention to correct information failure, as it helps consumers make more informed choices about the products they purchase.

Question 7. The primary goal of government intervention in correcting information failure is to

  1. Control the prices of goods and services in the market.
  2. Limit competition and protect businesses.
  3. Ensure a level playing field for all market participants.
  4. Enhance transparency and empower consumers with information.

Answer: 4. Enhance transparency and empower consumers with information.

Explanation:

The primary goal of government intervention in correcting information failure is to enhance transparency and empower consumers with information, enabling them to make better decisions in the market.

Question 8. Which of the following is an example of information failure?

  1. Consumers conduct thorough research before making a purchase.
  2. Companies provide complete and transparent information about their products.
  3. Misleading advertising that exaggerates the benefits of a product.
  4. Consumers make well-informed decisions based on market prices.

Answer: 3. Misleading advertising that exaggerates the benefits of a product.

Explanation:

Misleading advertising that exaggerates the benefits of a product is an example of information failure because it misinforms consumers and leads to imbalanced knowledge about the product’s actual attributes.

Question 9. The ultimate goal of government intervention to correct information failure is to

  1. Increase government control over market activities.
  2. Regulate market prices to ensure fairness.
  3. Ensure that consumers have access to accurate and relevant information.
  4. Promote competition among businesses.

Answer: 3. Ensure that consumers have access to accurate and relevant information.

Explanation:

The ultimate goal of government intervention to correct information failure is to ensure that consumers have access to accurate and relevant information, allowing them to make informed decisions in the market.

Question 10. Information failure refers to

  1. The inability of the government to regulate markets effectively
  2. The situation where the government has access to all relevant information
  3. The lack of information or asymmetric information in the market
  4. The government’s interference in market pricing mechanisms

Answer: 3. The lack of information or asymmetric information in the market

Question 11. Asymmetric information occurs when: 

  1. The government provides complete information to all market participants
  2. Market participants have equal knowledge about market prices
  3. One party in a transaction has more information than the other
  4. Buyers and sellers have equal knowledge about the quality of goods and services

Answer: 3. One party in a transaction has more information than the other

Question 12. Government intervention to correct information failure can involve

  1. Imposing price controls to regulate market prices
  2. Providing subsidies to consumers to increase demand for goods
  3. Encouraging firms to engage in price discrimination
  4. Implementing regulations to ensure accurate and transparent information

Answer: 4. Implementing regulations to ensure accurate and transparent information

Question 13. Which of the following is an example of government intervention to correct information failure?

  1. The government sets a maximum price for a particular good
  2. The implementation of consumer protection laws to prevent deceptive advertising
  3. The government provides subsidies to a specific industry
  4. The enforcement of monopolistic practices by the government

Answer: 2. The implementation of consumer protection laws to prevent deceptive advertising

Question 14. The main goal of government intervention to correct information failure is to

  1. Control market prices to ensure affordability for consumers
  2. Limit consumer choice and promote government-controlled markets
  3. Improve market transparency and protect consumers from fraud
  4. Increase government revenue by imposing higher taxes on businesses

Answer: 3. Improve market transparency and protect consumers from fraud

Question 15. How can government intervention help correct information failure in financial markets?

  1. Increasing taxes on financial transactions
  2. Imposing price controls on financial assets
  3. By requiring companies to disclose accurate financial information
  4. Limiting consumer access to financial products and services

Answer: 3. By requiring companies to disclose accurate financial information

Question 16. One of the challenges of government intervention to correct information failure is

  1. The lack of willingness from firms to provide accurate information
  2. The potential for excessive competition and price wars
  3. The difficulty in identifying goods with positive externalities
  4. The need to eliminate all market inefficiencies

Answer:  1. The lack of willingness from firms to provide accurate information

Question 17. Correcting information failure is essential to

  1. Ensure market prices are always at their equilibrium level
  2. Encourage firms to engage in price discrimination
  3. Achieve a more efficient allocation of resources in the market
  4. Allow market forces to completely determine prices and quantities

Answer: 3. Achieve a more efficient allocation of resources in the market

Government Intervention For Equitable Distribution

Question 1. Equitable distribution refers to

  1. Government control over the allocation of resources.
  2. The equal distribution of wealth and income among individuals.
  3. The concentration of resources among a few wealthy individuals.
  4. Market forces determine the distribution of resources.

Answer: 2. The equal distribution of wealth and income among individuals.

Explanation:

Equitable distribution refers to the fair and equal distribution of wealth and income among individuals in society

Question 2. Which of the following is a potential consequence of inequitable distribution of resources?

  1. Increased competition and economic growth.
  2. Higher levels of poverty and social unrest.
  3. Greater incentives for innovation and entrepreneurship.
  4. Improved living standards for all individuals.

Answer: 2. Higher levels of poverty and social unrest.

Explanation:

Inequitable distribution of resources can lead to higher levels of poverty and social unrest as wealth and income disparities can create economic and social inequalities.

Question 3. Government intervention for equitable distribution can include

  1. Implementing price controls to regulate resource allocation.
  2. Promoting competition among firms to increase efficiency.
  3. Providing social welfare programs to support vulnerable populations.
  4. Limiting’ the availability of resources to maintain scarcity.

Answer: 3. Providing social welfare programs to support vulnerable populations.

Explanation:

Government intervention for equitable distribution often includes providing social welfare programs to support vulnerable populations and reduce economic disparities.

Question 4. Which of the following is an example of government intervention for equitable distribution?

  1. Imposing higher taxes on high-income individuals.
  2. Deregulating industries to encourage competition.
  3. Allowing market forces to determine resource allocation.
  4. Implementing subsidies to support profitable businesses.

Answer: 1. Imposing higher taxes on high-income individuals.

Explanation:

Imposing higher taxes on high-income individuals is an example of government intervention for equitable distribution as it aims to redistribute wealth and income to support those with lower incomes.

Question 5. The main objective of government intervention for equitable distribution is to

  1. Maximize profits for businesses.
  2. Ensure that everyone has equal wealth and income.
  3. Promote economic growth and development.
  4. Reduce economic inequalities and provide support to the needy.

Answer: 4. Reduce economic inequalities and provide support to the needy.

Explanation:

The main objective of government intervention for equitable distribution is to reduce economic inequalities and provide support to vulnerable and disadvantaged populations to achieve a more equitable society.

Question 6. Which of the following is a potential consequence of income inequality?

  1. Increased economic growth and development.
  2. Reduced poverty and improved living standards for all.
  3. Social unrest and a sense of injustice in society.
  4. Greater investment and entrepreneurship.

Answer: 3. Social unrest and a sense of injustice in society.

Explanation:

Income inequality can lead to social unrest and a sense of injustice in society, as some individuals may feel marginalized or disadvantaged due to unequal access to resources.

Question 7. Government intervention for equitable distribution can include

  1. Imposing taxes on high-income individuals and redistributing the funds.’
  2. Implementing price controls to regulate market prices.
  3. Encouraging competition among businesses to reduce income disparities.
  4. Reducing government spending on social welfare programs.

Answer: 1. Imposing taxes on high-income individuals and redistributing the funds.

Explanation:

Government intervention for equitable distribution can include imposing progressive taxes on high-income individuals and redistributing the collected funds to support lower-income groups.

Question 8. Which of the following is an example of a government program aimed at equitable distribution?

  1. Providing subsidies to profitable businesses.
  2. Implementing a flat tax rate for all income levels.
  3. Offering financial assistance to low-income families.
  4. Reducing regulations on corporations.

Answer: 3. Offering financial assistance to low-income families.

Explanation:

Offering financial assistance to low-income families is an example of a government program aimed at equitable distribution, as it provides support to those in need and helps reduce income disparities.

Question 9. The main objective of government intervention for equitable distribution is to

  1. Maximize government revenue through taxation.
  2. Minimize government control over the economy.
  3. Ensure that everyone receives equal income and wealth.
  4. Reduce income and wealth disparities and promote social welfare.

Answer: 4. Reduce income and wealth disparities and promote social welfare.

Explanation:

The main objective of government intervention for equitable distribution is to reduce income and wealth disparities and promote social welfare by ensuring a fair and just distribution of resources in society.

Question 10. Equitable distribution refers to

  1. The equal distribution of income and wealth among all individuals in society
  2. The distribution of resources based on merit and individual effort
  3. The concentration of wealth and income in the hands of a few individuals
  4. The government’s interference in market pricing mechanisms

Answer: The equal distribution of income and wealth among all individuals in society

Question 11. Government intervention for equitable distribution can involve

  1. Implementing price controls to regulate market prices
  2. Providing subsidies to high-income individuals to support their lifestyles
  3. Imposing progressive taxation to redistribute wealth from the rich to the poor
  4. Encouraging firms to engage in price discrimination

Answer: 3. Providing subsidies to high-income individuals to support their lifestyles

Question 12. Which of the following is an example of government intervention for equitable distribution?

  1. The government imposed a flat tax rate on all income levels
  2. The implementation of consumer protection laws to ensure fair prices for goods
  3. The government provides subsidies to wealthy individuals for luxury goods
  4. The enforcement of monopolistic practices by the government

Answer: 1. The government imposed a flat tax rate on all income levels

Question 13. The main goal of government intervention for equitable distribution is to Posing higher taxes on businesses

  1. Control market prices to ensure affordability for consumers
  2. Limit consumer choice and promote government-controlled markets
  3. Achieve a more equal distribution of income and wealth in society
  4. Increase government revenue by im

Answer: 3. Achieve a more equal distribution of income and wealth in society

Question 14. How can progressive taxation help achieve a more equitable distribution of income

  1. By taxing low-income individuals at a higher rate than high-income individuals
  2. By taxing high-income individuals at a higher rate than low-income individuals
  3. Imposing a flat tax rate on all income levels
  4. Eliminating taxes on all sources of income

Answer: 2. By taxing high-income individuals at a higher rate than low-income individuals

Question 15. One of the challenges of government intervention for equitable distribution is

  1. The potential for excessive competition and price wars
  2. The lack of willingness from individuals to pay taxes for redistribution
  3. The difficulty in identifying goods with positive externalities
  4. The need to eliminate all market inefficiencies

Answer: 2. The lack of willingness from individuals to pay taxes for redistribution

Question 16. In the context of equitable distribution, what is a means-tested benefit?

  1. A benefit that is provided to all individuals regardless of their income level ‘
  2. A benefit that is provided based on specific criteria, such as income or assets
  3. A benefit that is only available to high-income individuals
  4. A benefit that is provided without any eligibility requirements

Answer: 2.  A benefit that is provided based on specific criteria, such as income or assets

Question 17. Correcting information failure is essential to

  1. Ensure market prices are always at their equilibrium level
  2. Encourage firms to engage in price discrimination
  3. Achieve a more efficient allocation of resources in the market
  4. Allow market forces to completely determine prices and quantities

Answer: 3. Achieve a more efficient allocation of resources in the market

CA Foundation Economics – Keynesian Theory Of Determination Of National Income Multiple Choice Questions

Determination Of National Income Introduction

Question 1. What is the central proposition of Keynesian theory regarding the determination of national income?

  1. National income is determined by aggregate supply.
  2. National income is determined by aggregate demand.
  3. National income is determined by both aggregate supply and aggregate demand.
  4. National income is determined by the government’s fiscal policy.

Answer: 2. National income is determined by aggregate demand.

Explanation:

According to Keynesian theory, the level of national income is determined primarily by the level of aggregate demand in the economy. Keynes argued that fluctuations in aggregate demand could lead to fluctuations in economic output and employment.

Question  2. During a recession, Keynesian economists recommend which of the following policies to stimulate economic growth and increase national income?

  1. Decreasing government spending and raising taxes.
  2. Decreasing the money supply to control inflation.
  3. Increasing government spending and lowering taxes.
  4. Reducing exports to protect domestic industries.

Answer: 3.  Increasing government spending and lowering taxes.


CA Foundation Economics - Keynesian Theory Of Determination Of National Income MCQs

Question  3. In the Keynesian model, what is the role of private investment in determining national income?

  1. Private investment has no impact on national income.
  2. Private investment solely determines national income.
  3. Private investment is a component of aggregate demand affecting national income.
  4. Private investment only affects the inflation rate, not national income.

Answer: 3. Private investment is a component of aggregate demand affecting national income.

Explanation:

In the Keynesian model, private investment is one of the components of aggregate demand, which also includes consumption, government spending, and net exports. Changes in private investment can have significant effects on overall aggregate demand and, consequently, on the level of national income.

Question  4. According to the Keynesian theory, what can lead to a situation of “underemployment equilibrium” in an economy?

  1. When aggregate demand exceeds aggregate supply.’
  2. When aggregate supply exceeds aggregate demand.
  3. When there is full employment in the economy.
  4. When aggregate demand is insufficient to create full employment.

Answer: 4. When aggregate demand is insufficient to create full employment.

Explanation:

“Underemployment equilibrium” occurs in the Keynesian model when aggregate demand in the economy is not strong enough to generate full

Question 5. Which of the following represents the primary tool for the government to influence aggregate demand and stabilize the economy, according to Keynesian economics?

  1. Monetary policy.
  2. Fiscal policy.
  3. Supply-side policies.
  4. Exchange rate policy.

Answer: 2. Fiscal policy.

Explanation:

According to Keynesian economics, fiscal policy, which involves government spending and taxation, is the primary tool for influencing aggregate demand and stabilizing the economy. By adjusting government spending and taxes, the government can directly impact aggregate demand and support economic growth and stability.

Question  6. Who is the main proponent of the Keynesian theory of determination of National Income?

  1. Adam Smith
  2. John Maynard Keynes
  3. Milton Friedman
  4. Friedrich Hayek

Answer: 2. John Maynard Keynes

Explanation:

John Maynard Keynes, a British economist, is the main proponent of the Keynesian theory of determination of National Income. He developed his ideas during the Great  Depression in the 1930s and proposed policies to address unemployment and economic downturns.

Question 7. According to Keynesian theory, what determines the level of employment and output in an economy?

  1. Consumer preferences and saving habits
  2. Government spending and taxation policies
  3. The interaction of aggregate demand and aggregate supply
  4. The natural rate of unemployment.

Answer: 3. The interaction of aggregate demand and aggregate supply

Explanation:

According to Keynesian theory, the level of employment and output in an economy is determined by the interaction of aggregate demand (total spending in the economy) and aggregate supply (the total production of goods and. services). Changes in aggregate demand, such as government spending or consumer expenditure, can lead to fluctuations in output and employment.

Question 8. The central idea of the Keynesian theory is that

  1. Government intervention is necessary to stabilize the economy
  2. Market forces alone can ensure full employment and economic stability
  3. Tax cuts are the most effective tool for economic growth
  4. Private investment is the primary driver of economic prosperity.

Answer: 1. Government intervention is necessary to stabilize the economy

Explanation:

The central idea of the Keynesian theory is that government intervention is necessary to stabilize the economy, particularly during times of recession or high unemployment. Keynes advocated for active government policies, such as increasing public spending or reducing taxes, to boost aggregate demand and promote economic growth.

Question 9. According to Keynes, what can lead to a situation of “effective demand deficiency” in the economy?

  1. Excessive government spending
  2. High levels of consumer saving
  3. Low interest rates set by the central bank
  4. High levels of inflation

Answer: 2. High levels of consumer saving

Explanation:

According to Keynes, a situation of “effective demand deficiency” can arise in the economy when there is a high level of consumer saving relative to consumer spending. In such a scenario, overall demand for goods and services may fall short of the economy’s productive capacity, leading to unemployment and economic stagnation.

Question 10. Keynesian theory suggests that during an economic downturn, the government should implement

  1. Austerity measures to reduce public debt
  2. Supply-side policies to boost production
  3. Contractionary monetary policies to control inflation
  4. Expansionary fiscal policies to increase spending

Answer: 4. Expansionary fiscal policies to increase spending

Explanation:

During an economic downturn, the Keynesian theory suggests that the government should implement expansionary fiscal policies. These policies involve increasing government spending and reducing taxes to boost aggregate demand, stimulate economic activity, and counter the negative effects of recession or unemployment.

Question 11. Keynes argued that during periods of economic recession or depression, the government should

  1. Increase taxes to reduce budget deficits
  2. Reduce government spending to control inflation
  3. Decrease interest rates to encourage private investment
  4. Increase government spending to stimulate aggregate demand

Answer: 4. Increase government spending to stimulate aggregate demand

Explanation:

Keynes advocated for an increase in government spending during periods of economic recession or depression. This increase in government expenditure would lead to higher aggregate demand, resulting in increased economic activity and employment.

Question 12. The concept of “Multiplier Effect” in the Keynesian theory suggests that

  1. Changes in government spending have a larger impact on National Income than changes in taxes.
  2. A change in investment leads to a proportionate change in National Income.
  3. Increases in exports result in higher economic growth and employment.
  4. Changes in consumption have a direct and immediate impact on investment.

Answer: 1. Changes in government spending have a larger impact on National Income than changes in taxes.

Explanation:

The concept of “Multiplier Effect” in the Keynesian theory suggests that changes in government spending have a larger impact on National Income than changes in taxes. An increase in government spending leads to a chain reaction of increased consumption and investment,  which further raises National Income multiple times.

Question 13. According to Keynes, in situations of insufficient aggregate demand, the economy may experience

  1. Demand-pull inflation
  2. Cost-push inflation
  3. Deflation and unemployment
  4. Stagflation

Answer: 3. Deflation and unemployment

Explanation:

According to Keynes, in situations of insufficient aggregate demand, the economy may experience deflation (a decrease in the general price level) and unemployment. He argued that inadequate demand could lead to a downward spiral of reduced production, lower employment, and falling prices.

Question 14. The Keynesian theory of the determination of national income was proposed by

  1. Adam.Smith
  2. John Maynard Keynes
  3. Milton Friedman
  4. Friedrich Hayek

Answer:  1. John Maynard Keynes

Question 15. According to the Keynesian theory, the level of national income is primarily determined by: 

  1. Aggregate demand in the economy
  2. Aggregate supply in the economy
  3. The government’s fiscal policy
  4. The central bank’s monetary policy

Answer:  2. Aggregate supply in the economy

Question 16. The central idea of the Keynesian theory is that:

  1. Supply creates its demand in the economy
  2. Savings and investment are equal in the long run
  3. The economy can experience prolonged periods of unemployment
  4. Government intervention is unnecessary in a free-market economy

Answer:  3. The economy can experience prolonged periods of unemployment

Question 17. Keynes argued that during economic downturns, the government should

  1. Reduce taxes and increase government spending
  2. Increase taxes and reduce government spending
  3. Allow market forces to correct the imbalances in the economy
  4. Privatize state-owned enterprises to stimulate economic growth

Answer: 1. Reduce taxes and increase government spending

Question 18. The concept of “effective demand” in the Keynesian theory refers to

  1. The total demand for goods and services in the economy
  2. The demand for goods and services by the government sector
  3. The demand for exports and imports in the economy
  4. The demand for consumer goods only, excluding investment

Answer: 1. The total demand for goods and services in the economy

Question 19. Keynesian policies are designed to address

  1. Short-run fluctuations in the business cycle
  2. Long-run structural issues in the economy
  3. Inflationary pressures in the economy
  4. Excessive government debt and deficits

Answer: 1. Short-run fluctuations in the business cycle

Question 20. In the Keynesian theory, if aggregate demand is insufficient to achieve full employment, the result will be

  1. Inflation
  2. Deflation
  3. Recession or unemployment
  4. Economic growth and stability

Answer: 3. Recession or unemployment

Question 21. The Keynesian theory gained prominence during which historical period?

  1. The Great Depression of the 1930s
  2. The Industrial Revolution of the 18th century
  3. The Renaissance era in Europe
  4. The dot-com bubble of the late 1990s

Answer: 1. The Great Depression of the 1930s

Circular Flow In A Simple Two Sector Model

Question 1. In a simple two-sector model of the circular flow, the two sectors are

  1. Government and households
  2. Business firms and households
  3. Government and business firms
  4. Foreign sector and households

Answer: 2. Business firms and households

Explanation: 

In a simple two-sector model of the circular flow, the two sectors are business firms and households. Business firms produce, goods and services, while households provide factors of production (such as labor and capital) and consume the produced goods and services.

Question 2. In the circular flow model, which sector is the ultimate consumer of goods and services?

  1. Business firms
  2. Households
  3. Government
  4. Foreign sector

Answer: 2. Households

Explanation:

In the circular flow model, households are the ultimate consumers of goods and services. They purchase goods and services from business firms in the product market.

Question 3. In the circular flow model, which sector supplies factors of production to business firms?

  1. Government
  2. Households
  3. Business firms
  4. Foreign sector

Answer: 2. Households

Explanation:

In the circular flow model, households supply factors of production (such as labor and capital) to business firms in exchange for wages, rent, and profits in the factor market.

Question 4. Which of the following flows represents the payment made by business firms to households for providing factors of production?

  1. Factor payments
  2. Transfer payments
  3. Investment spending
  4. Consumption expenditure

Answer: 1. Factor payments

Explanation:

Factor payments represent the payment made by business firms to households for providing factors of production (such as wages for labor, rent for land, and profits for entrepreneurship). It occurs in the factor market.

Question 5. In the circular flow model, which sector provides funds to business firms for investment purposes?

  1. Government
  2. Households
  3. Business firms
  4. Foreign sector

Answer: 2. Households

Explanation:

In the circular flow model, households are the primary savers, and they provide funds to business firms for investment purposes. These funds come from savings and are used by businesses to finance capital investments and expand their productive capacity.

Question 6. In the circular flow model, households are the

  1. Sellers of goods and services and buyers of factors of production
  2. Buyers of goods and services and sellers of factors of production
  3. Buyers of goods and services and buyers of factors of production
  4. Sellers of goods and services and sellers of factors of production

Answer: 1. Sellers of goods and services and buyers of factors of production

Explanation:

In the circular flow model, households act as sellers of factors of production (such as labor) to businesses and as buyers of goods and services produced by businesses.

Question 7. Which of the following best represents the flow of goods and services in the circular flow model?

  1. Money flows from households to businesses for goods and services.
  2. Goods and services flow from households to businesses in exchange for money.
  3. Money flows from businesses to households for factors of production
  4. Factors of production flow from businesses to households in exchange for money.

Answer: 2. Goods and services flow from households to businesses in exchange for money.

Explanation:

In the circular flow model, goods and services flow from households to businesses in exchange for money (income)

Question 8. Savings in the circular flow model refer to

  1. The money that businesses save from their profits
  2. The money that households save from their income
  3. The money that businesses invest in new projects
  4. The money that households spend on goods and services

Answer: 2. The money that households save from their income

Explanation:

Savings in the circular flow model refer to the portion of household income that is not spent on consumption and is instead saved for future use or investment.

Question 9. In the circular flow model, the total value of goods and services produced in the economy is measured by

  1. Gross Domestic Product (GDP)
  2. Gross National Product (GNP)
  3. Net Domestic Product (NDP)
  4. Net National Product (NNP)

Answer: 2. Gross Domestic Product (GDP)

Explanation:

In the circular flow model, the total value of goods and services produced in the economy is measured by Gross Domestic Product (GDP). GDP represents the sum of all final goods and services produced within a country’s borders during a specific period.

Question 10. In the circular flow model, households receive income in the form of

  1. Profits
  2. Taxes
  3. Wages, rent, and interest
  4. Government transfers

Answer: 3. Wages, rent, and interest

Explanation:

In the circular flow model, households receive income in the form of wages (for labor services), rent (for land), and interest (for capital). These are the payments households receive for providing their factors of production to firms.

Question 11. Which component of the circular flow represents the total spending by households on goods and services?

  1. Savings
  2. Investment
  3. Government spending
  4. Consumption expenditure

Answer: Consumption expenditure

Explanation:

Consumption expenditure represents the total spending by households on goods and services produced by firms. It is a crucial component of the circular flow as it indicates the demand side of the economy.

Question 12. In the two-sector circular flow model, savings by households are equal to

  1. Consumption expenditure
  2. Taxes paid to the government
  3. Investment by firms
  4. Government spending

Answer: 3. Investment by firms

Explanation:

In the two-sector circular flow model, savings by households are equal to investment by firms. In a simplified closed economy, savings equal investment since households’ savings are the source of funds for firms’ investment in new capital goods.

Question 13. The circular flow model assumes that all income earned by households is either spent on consumption or saved, and there is no

  1. Government intervention
  2. Investment by firms
  3. Financial sector
  4. Foreign trade

Answer: 4. Foreign trade

Explanation:

The circular flow model assumes a closed economy, meaning there is no foreign trade involved. It assumes that all income earned by households is either spent on consumption or saved, and there is no import or export of goods and services in this simplified model.

Question 14. In a simple two-sector model of the economy, the two main sectors are

  1. Household and government ‘
  2. Household and business
  3. Business and government
  4. Household and financial

Answer: 2. Household and government

Question 15. The circular flow model illustrates the flow of

  1. Goods and services and money between households and firms
  2. Goods and services and money between households and the government,
  3. Goods and services and money between businesses and the government ‘
  4. Goods and services and money between firms and financial ’ institutions

Answer: 1. Goods and services and money between households and the government,.

Question 16. In the circular flow model, households are the

  1. Buyers of goods and services and sellers of factors of production
  2. Buyers of goods and services and buyers of factors of production
  3. Sellers of goods and services and sellers of factors of production
  4. Sellers of goods and services and buyers of factors of production

Answer: 1. Buyers of goods and services and sellers of factors of production

Question 17. Which of the following represents the flow of money in the circular flow model?

  1. Money flows from households to businesses as payment for goods and services
  2. Money flows from businesses to households as payment for factors of production
  3. Money flows from businesses to the government as taxes
  4. Money flows from households to the government as taxes

Answer: 1. Money flows from households to businesses as payment for goods and services

Question 18. In the circular flow model, households receive income through

  1. Profits earned from business activities
  2. Government subsidies and transfers
  3. Wages, salaries, and rent for providing factors of production
  4. Interest earned from financial investments

Answer: 3. Wages, salaries, and rent for providing factors of production

Question 19. The circular flow model assumes that

  1. There is no saving or investment in the economy
  2. The government does not play a role in the economy
  3. There are no leakages or injections in the flow of income
  4. The economy is closed, with no foreign trade

Answer: 3. There are no leakages or injections in the flow of income

Question 20. Leakage in the circular flow model refers to

  1. Money flowing out of the economy due to imports
  2. Money flowing into the economy due to exports
  3. Savings and taxes that reduce the flow of income
  4. Government spending that increases the flow of income

Answer: 3. Savings and taxes that reduce the flow of income

Question 21. Injection in the circular flow model refers to

  1. Money flowing into the economy due to exports
  2. Money flowing out of the economy due to imports
  3. Government spending and investments that increase the flow of income
  4. Savings and taxes that reduce the flow of income

Answer: 3. Government spending and investments that increase the flow of income

Basic Concepts And Functions

Question 1. In economics, the study of how individuals and societies allocate limited resources to satisfy their unlimited wants is known as

  1. Microeconomics
  2. Macroeconomics
  3. Economic planning
  4. Economics

Answer: 4. Economics

Explanation:

Economics is the study of how individuals, households, firms, and societies allocate limited resources to satisfy their unlimited wants. It • encompasses both microeconomics (study of individual units) and macroeconomics (study of the overall economy).

Question 2. The total value of all final goods and services produced within a country’s borders during a specific period is known as

  1. Gross Domestic Product (GDP)
  2. Gross National Product (GNP)
  3. Net National Product (NNP)
  4. National Income

Answer: 1. Gross Domestic Product (GDP)

Explanation:

Gross Domestic Product  (GDP) is the total value of all final goods and services produced within a country’s borders during a specific period, usually a year. It is a key indicator of a country’s economic performance.

Question 3. Which of the following is NOT a factor of production in economics?

  1. Land
  2. Labor
  3. Capital
  4. Money

Answer: 4. Money

Explanation:

Money is not considered a factor of production in economics. The factors of production are land (natural resources), labor (human effort and skills), and capital (physical and human-made resources used in production).

Question 4. The price at which the quantity demanded of a good or service equals the quantity supplied is known as

  1. Equilibrium price
  2. Market price
  3. Maximum price
  4. Minimum price

Answer: 1. Equilibrium price

Explanation:

Equilibrium price is the price at which the quantity demanded of a good or service equals the quantity supplied in the market. At this price, there is no shortage or surplus of the product.

Question 5. The study of how individuals and firms make decisions and interact in markets is known as

  1. Macroeconomics
  2. Microeconomics
  3. Economic planning
  4. Econometrics

Answer: 2. Microeconomics

Explanation:

Microeconomics is the study of individual economic units such as households and firms and how they make decisions and interact in various markets. It focuses on the behavior of specific economic agents and the allocation of resources at a smaller level.

Question 6. Which of the following is a basic concept in economics that refers to the limited nature of resources?

  1. Opportunity cost
  2. Scarcity
  3. Inflation
  4. Gross Domestic Product (GDP)

Answer: 2. Scarcity

Explanation:

Scarcity is a fundamental concept in economics that refers to the limited availability of resources (such as land, labor, and capital) for unlimited wants and needs. It necessitates choices and trade-offs in allocating resources to various uses.

Question 7. Opportunity cost is defined as:

  1. The cost of producing one additional unit of a good or service
  2. The total cost of all inputs used in the production process
  3. The highest-valued alternative is given up when a choice is made
  4. The difference between total revenue and total cost

Answer:  3. The highest-valued alternative is given up when a choice is made

Explanation:

Opportunity cost is the value of the next best alternative forgone when a choice is made. It represents the trade-off between different options and helps in understanding the real cost of decisions.

Question 8. Which function of money refers to money serving as a medium of exchange in transactions?

  1. Store of value
  2. Unit of account
  3. Medium of exchange
  4. Standard of deferred payment

Answer: 3. Medium of exchange

Explanation:

The function of money as a medium of exchange refers to its use as a generally accepted medium to facilitate the exchange of goods and services in an economy. It eliminates the need for barter and enhances the efficiency of transactions.

Question 9. The Consumer Price Index (CPI) is a measure of

  1. The overall level of prices in an economy
  2. The total output produced in an economy
  3. The unemployment rate in an economy
  4. The government’s budget deficit

Answer: 1. The overall level of prices in an economy

Explanation:

The Consumer Price Index (CPI) is a measure of the overall level of prices of a basket of goods and services purchased by consumers. It is used to monitor inflation and changes in the cost of living over time.

Question 10. The total market value of all final goods and services produced within a country’s borders during a specific period is known as

  1. Gross Domestic Product (GDP)
  2. Gross National Product (GNP)
  3. Net Domestic Product (NDP)
  4. Net National Product (NNP)

Answer: 1. Gross Domestic Product (GDP)

Explanation:

Gross Domestic Product (GDP) is the total market value of all final goods and services produced within a country’s borders during a specific period, usually a  year. It is a key indicator of a country’s economic performance.

Question 11. The total value of all goods and services produced within a country’s borders during a specific period is known as

  1. Gross National Product (GNP)
  2. Gross Domestic Product (GDP)
  3. Net Domestic Product (NDP)
  4. Net National Product (NNP)

Answer: 2. Gross Domestic Product (GDP)

Explanation:

Gross Domestic Product (GDP) is the total value of all goods and services produced within a country’s borders during a specific period. It is a key indicator of a country’s economic performance. ,

Question 12. The measure of the responsiveness of quantity demanded of a good to a change in its price is known as

  1. Elasticity of demand
  2. Elasticity of supply
  3. Marginal utility
  4. Consumer surplus

Answer: 1. Elasticity of demand

Explanation:

The elasticity of demand measures the responsiveness of the quantity demanded of a good to a change in its price. It helps economists understand how sensitive consumers are to price changes.

Question 13. Which type of unemployment occurs when there is a temporary mismatch between job seekers and available job vacancies?

  1. Cyclical unemployment
  2. Frictional unemployment
  3. Structural unemployment
  4. Seasonal unemployment

Answer: 2. Frictional unemployment

Explanation:

Frictional unemployment occurs when individuals are temporarily between jobs or are seeking new employment opportunities. It is a natural and unavoidable part of the job search process.

Question 14. The interest rate at which a central bank lends money to commercial banks is known as

  1. Prime rate
  2. Discount rate
  3. Federal funds rate
  4. LIBOR rate

Answer: 2. Discount rate

Explanation:

The interest rate at which a central bank lends money to commercial banks is known as the discount rate. It is one of the tools used by central banks to control monetary policy.

Question 15. Economics is the study of

  1. How to maximize individual profits
  2. How to achieve economic equality among individuals
  3. How do societies allocate scarce resources to satisfy unlimited wants
  4. How to control inflation and unemployment in the economy

Answer: 3. How do societies allocate scarce resources to satisfy unlimited wants

Question 16. The basic economic problem arises because

  1. Governments are inefficient in resource allocation
  2. Human wants are unlimited, but resources are limited
  3. There is a surplus of goods and services in the market
  4. Consumers’ preferences change frequently

Answer: 2. Human wants are unlimited, but resources are limited

Question 17. The concept of opportunity cost refers to

  1. The monetary cost of an economic decision
  2. The highest-valued alternative that must be given up when a choice is made
  3. The additional cost incurred when producing one more unit of a good.
  4. The total cost of production of a firm

Answer: 2. The highest-valued alternative that must be given up when a choice is made

Question 18. In economics, the term “demand” refers to

  1. The quantity of a good or service that producers are willing to supply
  2. The quantity of a good or service that consumers are willing and able to buy at a given price
  3. The price at which producers are willing to sell a good or service
  4. The price at which consumers are willing and able to buy a good or service

Answer: 2. The quantity of a good or service that consumers are willing and able to buy at a given price

Question 19. The law of supply states that

  1. As the price of a good or service increases, the quantity demanded will increase
  2. As the price of a good or service increases, the quantity supplied will decrease
  3. As the price of a good or service decreases, the quantity demanded will decrease,
  4. As the price of a good or service decreases, the quantity supplied will increase

Answer: 4. As the price of a good or service decreases, the quantity supplied will increase

Question 20. Which of the following is a function of money in an economy

  1. To regulate imports and exports
  2. To control inflation and deflation
  3. To serve as a medium of exchange, a unit of account, and a store of value
  4. To determine the distribution of income and wealth

Answer: 3. To serve as a medium of exchange, a unit of account, and a store of value

Question 21. In a market economy, the allocation of resources is primarily determined by

  1. The government through central planning
  2. Consumer preferences and market forces of supply and demand
  3. Labor unions and collective bargaining
  4. International trade agreements and treaties

Answer: 2. Consumer preferences and market forces of supply and demand

Question 22. The production possibilities frontier (PPF) represents:

  1. The maximum quantity of goods and services that a country can produce using all available resources efficiently
  2. The minimum level of production a country must achieve to meet its basic needs
  3. The total output of a country’s economy in a given period
  4. The income distribution among different income groups in an economy

Answer: 1.  The maximum quantity of goods and services that a country can produce using all available resources efficiently

Aggregate Demand Function

Question 1. In an economy, the Aggregate Demand (AD) function is represented as AD = 1,000 – 100P, where P is the price level. Calculate the Aggregate Demand when the price level is ₹ 5.

  1. 1,500
  2. 500
  3. 1,000
  4. 2,000

Answer: 2. 500

Solution:

To calculate Aggregate Demand, we need to substitute the given price level (P) into the AD function.

AD = 1,000 – 100P

AD = 1,000- 100₹ 5

AD = 1,000-500

AD = 500

So, the Aggregate Demand when the price level is ₹ 5 is 500

Question 2. In an economy, the Aggregate Demand (AD) function is represented as AD = 2,500 – 150P, where P is the price level. Calculate the Aggregate Demand when the price level is ₹ 10.

  1. 1,500
  2. 2,500
  3. 2,000
  4. 3,000

Answer: 3 .2,000

Solution: 

To calculate Aggregate Demand, we need to substitute the given price level (P) into the AD function.

AD = 2,500 – 150P

P = ₹ 10

AD = 2,500 – 150 × ₹ 10

AD = 2,500- 1,500,

AD = 2,000.

So, the Aggregate Demand when the price level is ₹10 is 2,000.

Question 3. In an economy, the Aggregate Demand (AD) function is represented as AD = 3,000 – 200P, where P is the price level. Calculate the Aggregate Demand when the price level is ₹ 15.

  1. 2,500
  2. 3,000
  3. 1,500
  4. 2,000

Answer: 3. 1,500

Solution:

To calculate Aggregate Demand, we need to substitute the given price level (P) into the AD function.

AD = 3,000 – 200P

P = ₹ 15

AD = 3,000 – 200 ×  ₹ 15

AD = 3,000 – 3,000 AD = 1,500

So, the Aggregate Demand when the price level is ₹ 15 is 1,500.

Question 4. In an economy, the aggregate demand (AD) function is represented as AD = 2,000 – 100P, where P is the price level. Calculate the equilibrium level of aggregate demand when the price level (P) is ₹15.

  1. ₹ 1,000
  2. ₹ 2,500
  3. ₹  1,500
  4. ₹  500

Answer: 3. ₹ 1,500

Solution:

To calculate the equilibrium level of aggregate demand, we need to substitute the given price level (P) into the AD function and solve for AD.

AD = 2,000 – 100P

P = ₹ 15

AD = 2,000 – 100  × ₹ 15.

AD = 2,000 – ₹ 1,500 AD = ₹ 500

So, the equilibrium level of aggregate demand when the price level (P)  is ₹15 is  1,500.

The Consumption Function

Question 1. In an economy, the consumption function is represented as C = 500 +  0. 8Y, where Y is the disposable income. Calculate the level of consumption when the disposable income (Y) is ₹  2,000.

  1. ₹ 1,800
  2. ₹ 1,900
  3. ₹  2,500
  4. ₹  2,200 ‘

Answer: 2. ₹ 1,900

Solution:

To calculate the level of consumption, we need to substitute the given disposable income (Y) into the consumption function and solve for C.

C = 500 + 0.8Y C = 500 + 0.8 × ₹ 2,000

C = 500 + ₹ 1,600

C = ₹ 2,100 ,

So, the level of consumption when the disposable income (Y) is ₹  2,000 is ₹ 1,900.

Question 2. In an economy, the consumption function is represented as C = 500 + 0. 8Y, where C is consumption and Y is disposable income. Calculate the level of consumption when disposable income (Y) is ₹ 1,000.

  1. ₹ 1,200
  2. ₹ 1,300
  3. ₹ 1,400
  4. ₹ 1,500

Answer: 2.  ₹ 1,300

Solution:

To calculate the level of consumption, we need to substitute the given disposable income (Y) into the consumption function and solve for C.

C = 500 + 0.8Y .

C = 500 + 0.8 × ₹ 1,000 C = 500 + ₹ 800

C  = ₹1,300

So, the level of consumption when disposable income (Y) is ₹ 1,000 is ₹ 1,300.

Question 3. In an economy, the consumption function is represented as C = 1,000 + 0.8Y, where Y is the disposable income. Calculate the level of consumption when the disposable income (Y) is ₹ 2,000.

  1. ₹ 800
  2. ₹ 1,200
  3. ₹ 2,400
  4. ₹ 2,800

Answer: ₹ 1,200

Solution:

To calculate the level of consumption, we need to substitute the given disposable income (Y) into the consumption function and solve for C.

C = 1,000+ 0.8Y C = 1,000+ 0.8 × ₹ 2,000

C = 1,000 + ₹ 1,600

C = ₹ 2,600

So, the level of consumption when the disposable income (Y) is₹ 2,000 is ₹ 1,200

Relationship Between Income And Consumption

Question 1. In an economy, the consumption function is represented as C = 800 + 0. 6Y, where Y is the disposable income. Calculate the level of consumption when the disposable income (Y) is  ₹ 3,000. 

  1. ₹ 1,000
  2. ₹ 1,800
  3. ₹ 2,200
  4. ₹ 1,400

Answer: 2. ₹ 1,800

Solution:

To calculate the level of consumption, we need to substitute the given disposable income (Y) into the consumption function and solve for C.

C = 800 + 0.6Y – C = 800 + 0.6 × ₹  3,000

C = 800 + ₹ 1,800

C = ₹ 2,600

So, the level of consumption when the disposable income (Y) is ₹ 3,000. is ₹ 1,800.

Question 2. In an economy, the consumption function is represented as C = 800 + 0. 6Y, where Y is the disposable income. Calculate the level of consumption when the disposable income (Y) is? 2,500.

  1. ₹ 1,500
  2. ₹ 2,000
  3. ₹  2,200
  4. ₹ 2,800

Answer: 3. ₹ 2,200

Solution:

To calculate the level of consumption, we need to substitute the given disposable income (Y) into the consumption function and solve for C.

C = 800 + 0.6Y C

= 800 + 0.6 × ₹ 2,500

C = 800 + ₹ 1,500

C = ₹ 2,300

So, the level of consumption when the disposable income (Y) is ₹ 2,500 is ₹ 2,200.

Question 3. In an economy, the consumption function is represented as C = 1,000 + 0.8Y, where C is the consumption and Y is the disposable income. Calculate the level of consumption when the disposable income (Y) is ₹ 5,000.

  1. ₹ 1,800
  2. ₹ 3,800
  3. ₹ 4,000
  4. ₹ 5,000

Answer: 2. ₹ 3,800

Solution:

To calculate the level of consumption, we need to substitute the given disposable income (Y) into the consumption function and solve for C.

C = 1,000 + 0.8Y C = 1,000 + 0.8 × ₹ 5,000

C= 1,000 + ₹ 4,000

C = ₹ 5,000

So, the level of consumption when the disposable income (Y) is ₹ 5,000 is ₹ 3,800.

The Relationship Between Income, Consumption And Saving

Question 1. In an economy, the consumption function is represented as C = 1,000 + 0.6Y, where C is the consumption and Y is the disposable income. Calculate the level of saving when the disposable income (Y) is ₹ 4,000.

  1. ₹ 2,400
  2. ₹ 1,600
  3. ₹  2,000
  4. ₹ 1,000

Answer: 1. ₹ 2,400

Solution:

To calculate the level of saving, we need to subtract the consumption from the disposable income (Y).

Saving (S) = Y – C

Saving (S) = ₹ 4,000 – (1,000 + 0.6 × ₹ 4,000)

Saving (S) = ₹ 4,000 – (1,000 + ₹ 2,400)

Saving (S) = ₹ 4,000 – ₹ 3,400 Saving (S) = ₹ 600

So, the level of saving when the disposable income (Y) is ₹ 4,000 is ₹ 2,400.

Question 2. In an economy, the consumption function is represented as C = 800 + 0. 6Y, where C is the consumption, Y is the disposable income, and S is the saving. Calculate the level of saving when the disposable income (Y) is ₹ 2,000.

  1. ₹ 1,200
  2. ₹ 800
  3. ₹ 400
  4. ₹ 1,600

Answer: 3. ₹ 400

Solution:

The saving (S) is the difference between disposable income (Y) and consumption (C). We can calculate it using the given consumption

Question 3. In an economy, the consumption function is represented as C = 1,000 + 0.6Y, where C is the consumption, and Y is the disposable income. Calculate the level of saving when the disposable income (Y) is ₹ 4,000.

  1. ₹ 600
  2. ₹ 1,600
  3. ₹ 2,400
  4. ₹ 2,600

Answer: 2. ₹ 1,600

Solution:

To calculate the level of saving, we need to subtract the consumption (C) from disposable income (Y).

S = Y-C

S = ₹ 4,000 – (1,000 + 0.6 × ₹ 4,000)

S = ₹ 4,000-(1,000+ ₹ 2,400)

S = ₹ 4,000 – ₹ 3,400 S = ₹  600 ‘

So, the level of saving when the disposable income (Y) is ₹ 4,000 is ₹ 1,600.

Aggregate Supply

Question 1. In an economy, the short-run aggregate supply (SRAS) curve is represented as SRAS = 1,500 + 0.5P, where P is the price level. Calculate the level of aggregate supply when the price level (P) is ₹ 10.

  1. 1,550
  2. 2,000
  3. 2,500
  4. 1,000

Answer: 1. 1,550

Solution:

To calculate the level of aggregate supply, we need to substitute the given price level (P) into the short-run aggregate supply (SRAS) curve and solve for SRAS.

SRAS = 1,500+ 0.5P .

SRAS = 1,500+ 0.5 × ₹

SRAS = 1,500 + ₹ 5

SRAS = 1,550

So, the level of aggregate supply when the price level (P) is ₹ 10 is 1,550.

Question 2. In an economy, the short-run aggregate supply (SRAS) curve is represented as SRAS = 2,000 + 100P, where P is the price level. 

  1. 2,100
  2. 3,000
  3. 2,500
  4. 2,200

Answer: 1. 2,100

Solution:

To calculate the level of aggregate supply, we need to substitute the given price level (P) into the SRAS curve and solve for SRAS.

SRAS = 2,000 + 100P

SRAS = 2,000+ 100 × ₹ 10

SRAS = 2,000+ ₹ 1,000

SRAS = ₹ 3,000

So, the level of aggregate supply when the price level (P) is ₹ 10 is 2,100.

Question 3. In an economy, the aggregate supply (AS) function is represented as AS = 2,000 + 100P, where P is the price level. Calculate the level of aggregate supply when the price level (P) is ₹ 10.

  1. ₹ 2,000
  2. ₹ 3,000
  3. ₹ 2,100
  4. ₹  2,500

Answer: 2. ₹  3,000

Solution:

To calculate the level of aggregate supply, we need to substitute the given price level (P) into the AS function and solve for AS.

AS = 2,000 + 100P

AS = 2,000 + 100 × ₹ 10

AS = 2,000 + 1,000

AS = ₹  3,000

So, the level of aggregate supply when the price level (P) is t 10 is ₹ 3,000.

The Two-Sector Model Of National Income Determination

Question 1. In the two-sector model of National Income determination, the two main sectors are

  1. Government and households
  2. Government and foreign trade
  3. Households and firms (businesses)
  4. Firms (businesses) and foreign trade

Answer: 3. Households and firms (businesses)

Explanation:

In the two-sector model, the economy consists of two main sectors – households and firms (businesses). Households are the consumers who own factors of production (labor, land, capital), and firms are the producers who use these factors to produce goods and services.

Question 2. In the two-sector model, the total output produced by firms is either consumed by households or

  1. Saved by households
  2. Invested by firms
  3. Exported to foreign countries
  4. Imported from foreign countries

Answer: 1. Saved by households

Explanation:

In the two-sector model, the total output produced by firms is either consumed by households or saved by households. Saving is the portion of income not spent on consumption.

Question 3. In the two-sector model, the total income earned by households is either spent on consumption or

  1. Invested by firms
  2. Taxed by the government
  3. Exported to foreign countries
  4. Imported from foreign countries

Answer: 1. Invested by firms

Explanation:

In the two-sector model, the total income earned by households is either spent on consumption or invested by firms. Investment represents the portion of income used by firms to acquire new capital goods and expand production.

Question 4. In the two-sector model, the equilibrium level of National Income occurs when

  1. Total consumption equals total investment
  2. Total savings equals total investment
  3. Total consumption equals total savings
  4. Total income equals total expenditure

Answer: 3. Total consumption equals total savings

Explanation:

In the two-sector model, the equilibrium level of National Income occurs when total consumption equals total savings. At equilibrium, all produced output is either consumed or saved by households.

Question 5. If total consumption in the two-sector model is greater than total income, the economy will experience

  1. An increase in inventories
  2. An increase in investment
  3. An increase in National Income
  4. A decrease in National Income

Answer: 4. A decrease in National Income

Explanation:

If total consumption in the two-sector model is greater than total income, it means households are spending more than their current income, resulting in dissaving. This leads to a decrease in National Income until consumption and income are equalized at equilibrium.

Question 6. In the two-sector model, the income earned by households is allocated between

  1. Taxes and Savings
  2. Consumption and Savings
  3. Consumption and Investment
  4. Taxes and Investment

Answer: 2. Consumption and Savings

Explanation:

In the two-sector model, the income earned by households is allocated between consumption (C) and savings (S). Consumption expenditure represents the total spending by households on goods and services, while savings represent the portion of income not spent on consumption.

Question 7. In the two-sector model, the equilibrium condition is achieved when

  1. Consumption equals savings
  2. Consumption exceeds savings
  3. Savings exceed consumption
  4. Consumption and savings are both zero

Answer: Consumption equals savings Explanation:

In the two-sector model, equilibrium is achieved when consumption (C) equals savings (S). This means that all income earned by households is either spent on consumption or saved, and there is no leakage from the circular flow of income.’

Question 8. If in the two-sector model, consumption exceeds income, it would result

  1. Equilibrium
  2. A budget surplus
  3. A budget deficit
  4. An increase in investment

Answer: 3. A budget deficit.

Explanation:

In the two-sector model, if consumption exceeds income, it would result in a budget deficit. This situation occurs when households are spending more than their income, leading to a shortfall in savings.

Question 9. In the two-sector model, investment is assumed to be

  1. Autonomous
  2. Derived
  3. Dependent on consumption
  4. Dependent on government spending

Answer: 1. Autonomous

Explanation:

In the two-sector model, investment is assumed to be autonomous, meaning it is. not directly dependent on the level of income or consumption. It is considered an exogenous variable, determined by factors such as business expectations and government policies.

Question 10. In the two-sector model, the total income earned by households is divided into two components: consumption expenditure (C) and

  1. Gross Domestic Product (GDP)
  2. Investment (I)
  3. Net exports (NX)
  4. Savings (S)

Answer: 4. Savings (S)

Explanation:

In the two-sector model, the total income earned by households is divided into two components: consumption expenditure (C) and savings (S). The income that is not spent on consumption is saved.

Question 11. The equilibrium condition in the two-sector model occurs when

  1. Savings are greater than investment
  2. Consumption equals investment
  3. Savings equal investment
  4. Consumption equals GDP

Answer: 3. Savings equal investment

Explanation:

The equilibrium condition in the two-sector model occurs when total savings (S) equal total investment (I). At equilibrium, the amount households save is equal to the amount firms invest, ensuring that all income generated in the economy is either consumed or invested.

Question 12. If, in the two-sector model, aggregate savings are greater -than- aggregate investment, the economy is in

  1. Recession
  2. Equilibrium
  3. Inflation
  4. Unemployment

Answer: 1. Recession

Explanation:

If aggregate savings (S) are greater than aggregate investment (I) in the two-sector model, it means that households are saving more than what firms are investing. This situation may lead to a decrease in demand and economic slowdown, which is often associated with a recession.

Question 13. The formula for calculating national income (Y) in the two-sector model ‘ is

  1. Y = C – S
  2. Y = C + S
  3. Y = C + I
  4. Y = C -I

Answer: 1. Y = C + S

Explanation:

In the two-sector model, national income (Y) is equal to consumption expenditure (C) plus savings (S). This is because all income earned by households is either consumed or saved, so Y = C + S.

Question 14. In the two-sector model of national income determination, the two main sectors are:

  1. Household and government
  2. Household and business
  3. Business and government
  4. Government and foreign trade

Answer:  2. Household and business

Question 15. The two-sector model simplifies the economy by considering the interactions between

  1. Households and businesses only
  2. Households and the government only
  3. Businesses and the government only
  4. Households and the foreign sector only

Answer: 1. Households and businesses only

Question 16. In the two-sector model, households are the main

  1. Producers of goods and services
  2. Consumers of goods and services
  3. Suppliers of factors of production
  4. Investors in the economy

Answer: 2. Consumers of goods and services

Question 17. The two-sector model assumes that all the income earned by households is either:

  1. Spent on consumption or saved
  2. Spent on consumption or invested
  3. Spent on imports or exports
  4. Spent on consumption or taxes

Answer: 1. Spent on consumption or saved

Question 18. Investment in the two-sector model refers to

  1. The purchase of financial assets by households
  2. The purchase of physical capital goods by businesses
  3. The government’s spending on infrastructure projects
  4. The government’s spending on social welfare programs

Answer: 2. The purchase of physical capital goods by businesses

Question 19. Savings in the two-sector model is equal to

  1. Investment
  2. Consumption
  3. Income earned by households
  4. Government spending

Answer: 1. Investment

Question 20. The two-sector model assumes that there is no

  1. Government intervention in the economy
  2. Unemployment or Inflation
  3. Saving or investment in the economy
  4. International trade or foreign sector interaction

Answer: 4. International trade or foreign sector interaction

Question 21. In the two-sector model, the equilibrium condition is achieved when

  1. Savings are equal to consumption
  2. Investment is equal to consumption
  3. Investment is equal to savings
  4. Savings are equal to government spending

Answer: 3. Investment is equal to savings

Equilibrium With Unemployment Or Inflation

Question 1. In an economy, the aggregate demand (A(d) function is represented as AD = 2,000 -100 P, and the short-run aggregate supply (SRAS) function is represented as SRAS = 1,000 +150P. Calculate the equilibrium price level (P) and output level when the economy is at equilibrium.

  1. P = ₹ 6,Y= 1,400
  2. P = ₹ 8, Y = 1,200
  3. P = ₹ 10, Y = 1,000
  4. P = ₹ 12, Y = 800

Answer: 1. P = ₹ 6, Y = 1,400

Solution:

To find the equilibrium price level (P) and output level (Y), we need to set the aggregate demand (AD) equal to the short-run aggregate supply (SRAS) and solve for P and Y.

Equilibrium occurs when AD = SRAS

2,000- 100P = 1,000+ 150P

Combine the terms with P on one side:

2000-10OP – 150P = 1,000

Simplify the equation:

2000- 250P = 1,000

Subtract 2,000 from both sides

-250 P =-1,000

Divide both sides by -250

P = 4

Now that we have the equilibrium price level (P), we can find the output level (Y) by substituting P back into the SRAS function

SRAS = 1,000 + 150P

SRAS = 1,000 + 150 × 4

SRAS = 1,000 + 600 SRAS = 1,600

So, the equilibrium price level (P) is ₹ 6, and the output level (Y) is 1,400.

Question 2. In an economy, the aggregate demand (AD) and short-run aggregate supply (SRAS) functions are given by AD = 2,000 – 100P and SRAS = 1.0 + 150P, where P is the price level. Calculate the equilibrium price level and output level. ,

  1. Equilibrium price level: ₹ 8; Output level: 1,400 units
  2. Equilibrium price level: ₹ 10; Output level: 1,500 units
  3. Equilibrium price level: ₹ 12; Output level: 1,600 units
  4. Equilibrium price level: ₹ 6; Output level: 1,200 units

Answer: 1. Equilibrium price level: ₹ 8; Output level: 1,400 units

Solution:

To find the equilibrium price level and output level, we need to set the aggregate. demand (AD) equal to the short-run aggregate supply (SRAS) and solve for P.

AD = SRAS

2000- 100P = 1,000 + 150P

2,000 -1,000 – 150P + 100P

1.0 = 250P

P = \(\frac{1000}{250}\) P = 4

Now, we can find the output level (Y) using either the AD or SRAS function.

Y = AD = 2,000 -100P

= 2,000 – 100 × 4

= 2,000 – 400

= 1,600 units So, the equilibrium price level is ₹  4, and the output level is 1,600 units.

Question 3. In an economy, the aggregate demand (A(d) function is represented as  AD = 2,000 -100P, and the short-run aggregate supply (SRAS) function is represented as SRAS = 500 + 100P. Calculate the equilibrium price level and output level in the economy. 

  1. Equilibrium price level = ₹ 8; Equilibrium output level = 1,200 units
  2. Equilibrium price level = ₹ 10; Equilibrium output level = 1,000 units
  3. Equilibrium price level = ₹ 12; Equilibrium output level = 800 units
  4. Equilibrium price level = ₹ 14; Equilibrium output level = 600 units

Answer: 2. Equilibrium price level = ₹ 10; Equilibrium output level = 1,000 units

Solution:

To find the equilibrium price level and output level, we need to equate the aggregate demand (AD) function and the short-run aggregate supply (SRAS) function.

Equating AD and SRAS:

2,000- 100P = 500 + 100P

Now, solve for P

2000- 500 = 100P + 100P

1,500 = 200P

P = 1,500/200 P = 7.5

Now, substitute the value of P into either the AD or SRAS function to find the equilibrium output level:

AD = 2,000 – 100 P.

AD = 2,000-100 × 7.5

AD = 2,000 – 750.

AD = 1,250

So, the equilibrium price level is ₹ 7.5, and the equilibrium output level is 1,250 units.

The Investment Multiplier

Question 1. The investment multiplier measures the relationship between

  1. Consumer spending and investment
  2. Government spending and investment
  3. Investment and changes in national income
  4. Changes in national income and consumer spending

Answer: 3. Investment and changes in national income

Explanation:

The investment multiplier measures the relationship between changes in investment and the resulting changes in national income. It shows how an initial change in investment can lead to a more significant overall increase in national income through the multiplier effect.

Question 2. The formula to calculate the investment multiplier is

  1. Investment Multiplier = 1 / Marginal Propensity to Consume (MPC)
  2. Investment Multiplier = 1 / Marginal Propensity to Save (MPS)
  3. r (c) Investment Multiplier = 1 + Marginal Propensity to Consume (MPC)
  4. Investment Multiplier = 1 + Marginal Propensity to Save (MPS)

Answer: 1. Investment Multiplier = 1 + Marginal Propensity to Save (MPS)

Explanation:

The formula to calculate the investment multiplier is 1 / (1 – MPS) or equivalently, 1 / MPS. Since MPS (Marginal Propensity to Save) is the proportion of additional income that households save, the investment multiplier is 1 divided by (1 – MPS) or 1 divided by MPS.

Question 3. If the Marginal Propensity to Save (MPS) is 0.2, what is the value of the investment multiplier?

  1. 1.2
  2. 5
  3. 0.2.
  4. 0.8.

Answer: 4. 0.8

Explanation:

The investment multiplier is calculated as 1 / (1 – MPS). If MPS is 0.2, then the investment multiplier is 1 / (1 – 0.2)

= \(\frac{1}{0.8}\)

= 5.

Question 4. The investment multiplier indicates that an increase in investment of a certain amount will lead to an

  1. Smaller increase in national income
  2. Equal decrease in national income
  3. Larger increase in national income
  4. No change in national income

Answer: 3. Larger increase in national income

Explanation:

The investment multiplier shows that an increase in investment will result in a larger overall increase in national income. For example, if the investment multiplier is 5, an initial increase in investment of ₹ 100 will lead to a total increase in national income of ₹ 500 (5 times the initial investment).

Question 5. The investment multiplier assumes that

  1. The economy is at full employment
  2. Consumer spending is constant
  3. Government spending is constant
  4. There are no leakages in the economy

Answer: 4. There are no leakages in the economy

Explanation:

The investment multiplier assumes that there are no leakages in the economy, meaning that all additional income generated through the multiplier effect is spent and not saved or taxed away. In other words, the multiplier effect assumes that the entire increase in income is, spent on consumption and not saved or taxed.

Question 6. The investment multiplier measures the

  1. Increase in government spending due to an increase in investment
  2. Increase in investment due to an increase in government spending
  3. Total change in national income resulting from a change in investment
  4. Total change in investment resulting from a change in national income

Answer: 3. Total change in national income resulting from a change in investment

Explanation:

The investment multiplier measures the total change in national income that results from a change in investment. It shows the magnified impact of changes in investment on the overall economy.

Question 7. The value of the investment multiplier is calculated as

  1. 1 / Marginal Propensity to Consume (MPC)
  2. Marginal Propensity to Consume (MPC) /1
  3. 1 / Marginal Propensity to Save (MPS)
  4. Marginal Propensity to Save (MPS) /1

Answer: 1 / Marginal Propensity to Save (MPS)

Explanation:

The value of the investment multiplier (K) is calculated as 1 / Marginal Propensity to Save (MPS). It shows how changes in investment lead to a magnified change in national income.

Question 8. If the Marginal Propensity to Consume (MPC) is 0.8, the value of the investment multiplier will be

  1. 2
  2. 3
  3. 4
  4. 5

Answer: 3. 4

Explanation:

If the Marginal Propensity to Consume (MPC) is 0.8, the value of the investment multiplier (K) is calculated as 1 / (1 – MPC) = 1 / (1 – 0.8)

=  \(\frac{1}{0.2}\)

= 5. ‘

Question 9. The investment multiplier can be used to calculate the total change in income when there is an autonomous increase in investment. Autonomous investment refers to investment that

  1. Depends on changes in income
  2. Does not depend on changes in income
  3. Is made by the government sector
  4. Is made by the foreign sector

Answer: 2. Does not depend on changes in income.

Explanation:

Autonomous investment refers to investment that does not depend on changes in income. It is independent of the level of income in the economy. The investment multiplier helps calculate the total change in income resulting from this autonomous increase in investment.

Question 10. If the investment multiplier is 3, an initial increase in investment of ? 100 million will lead to a total increase in the national income of

  1. ? 200 million
  2. ? 300 million
  3. ? 400 million
  4. ? 500 million

Answer: 2. 300 million

Explanation:

If the investment multiplier is 3 and there is an initial increase in investment of ^ 100 million, the total increase in national income will be ? 100 million * 3 = ? 300 million.

Question 11. The investment multiplier measures the

  1. Change in investment due to changes in interest rates.
  2. Change in investment due to changes in government spending.
  3. Change in national income due to changes in investment..
  4. Change in consumption due to changes in income.

Answer:  Change in national income due to changes in investment.

Explanation:

The investment multiplier measures the change in national income that results from a change in investment spending. It shows how an initial change in investment can lead to a larger overall impact on the economy through a multiplier effect.

Question 12. The formula for calculating the investment multiplier is

  1. Investment Multiplier = 1 / Marginal Propensity to Consume (MPC)
  2. Investment Multiplier = 1 / Marginal Propensity to Save (MPS)
  3. Investment Multiplier = 1 / Marginal Propensity to Import (MPI)
  4. Investment Multiplier = 1 / Marginal Propensity to Invest (MPI)

Answer: 1. Investment Multiplier = 1 / Marginal Propensity to Consume (MPC)

Explanation:

The formula for calculating the investment multiplier is: Investment Multiplier = 1 / Marginal Propensity to Consume (MPC). The marginal propensity to consume (MPC) represents the fraction of additional income that households spend on consumption.

Question 13. If the marginal propensity to consume (MPC) is 0.8, the value of the investment multiplier would be

  1. 0.8
  2. 5
  3. 0.2
  4. 2

Answer: 4. 2

Explanation:

If the marginal propensity to consume (MPC) is 0.8, the value of the investment multiplier would be 1 / 0.8 = 2. This means that a change in investment will lead to a two-times larger change in national income due to the multiplier effect.

Question 14. The investment multiplier is based on the idea that an initial change in investment

  1. Directly affects consumption spending by households.
  2. Indirectly affects consumption and investment spending through changes in interest rates.
  3. Indirectly affects consumption spending by households.
  4. Directly affects government spending.

Answer: 3. Indirectly affects consumption spending by households. Explanation: .

The investment multiplier is based on the idea that an initial change in investment indirectly affects consumption spending by households. An increase in investment leads to an increase in income, which, in turn, increases consumption spending by households.

Question 15. If the investment multiplier is 4, ₹ 100 million increase in investment will lead to a total increase in national income of

  1. ₹ 200 million
  2. ₹ 400 million
  3. ₹ 600 million
  4. ₹ 800 million

Answer: 3. ₹ 600 million

Explanation:

If the investment multiplier is 4, ₹ 100 million increase in investment will lead to a total increase in national income of ₹ 100 million × 4 = ₹ 400 million. The investment multiplier shows the cumulative impact of changes in investment on national income.

Question 16. The investment multiplier is a concept used in economics to measure

  1. The impact of changes in investment on the overall economy
  2. The efficiency of the financial sector in generating profits
  3. The effectiveness of government spending on economic growth
  4. The correlation between inflation and unemployment

Answer: 1. The impact of changes in investment on the overall economy

Question 17. The investment multiplier is calculated as the

  1. Change in investment divided by the change in national income
  2. Change in national income divided by the change in investment
  3. Change in consumption divided by the change in investment
  4. Change in government spending divided by the change in investment

Answer: 2. Change in national income divided by the change in investment

Question 18. A higher investment multiplier implies that

  1. Changes in investment have a larger impact on the overall economy
  2. Changes in investment have a smaller impact on the overall economy –
  3. The economy is in a recessionary phase
  4. The economy is in an inflationary phase

Answer: 1. Changes in investment have a larger impact on the overall economy

Question 19. The investment multiplier process works through

  1. Changes in consumer spending due to changes in investment
  2. Changes in government spending due to changes in investment
  3. Changes in aggregate demand due to changes in investment
  4. Changes in aggregate supply due to changes in investment

Answer: 3. Changes in aggregate demand due to changes in investment

Question 20. The value of the investment multiplier is influenced by the

  1. Level of government regulation in the economy
  2. Level of unemployment in the economy
  3. Marginal propensity to consume (MPC) and the marginal propensity to save (MPS)
  4. Exchange rate of the national currency

Answer: 3. Marginal propensity to consume (MPC) and the marginal propensity to save (MPS)

Question 21. In an economy with a high investment multiplier, a decrease in investment  can lead to

  1. A significant decrease in national income and output
  2. An increase in consumer spending to compensate for the decrease in investment
  3. An increase in government spending to compensate for the decrease in investment
  4. No significant impact on the overall economy

Answer: 1. A significant decrease in national income and output

Question 22. The investment multiplier is a key concept in understanding the impact of

  1. Fiscal policy on economic growth
  2. Monetary policy on interest rates
  3. Foreign trade on exchange rates
  4. Supply-side policies on unemployment

Answer: 1. Fiscal policy on economic growth

Question 23. The investment multiplier is a theoretical concept that assumes:

  1. Investment has a fixed impact on the economy
  2. The economy is in a constant state of equilibrium
  3. There are no leakages in the circular flow of income
  4. All other factors in the economy remain constant

Answer: 4. All other factors in the economy remain constant

Determination Of Equilibrium Income: Three Sector Model

Question 1. In the three-sector model, the three main sectors of the economy are

  1. Government, households, and foreign trade
  2. Government, households, and financial institutions
  3. Households, firms (businesses), and foreign trade
  4. Households, firms (businesses), and financial institutions

Answer:  3. Government, households, and foreign trade

Explanation:

In the three-sector model, the economy consists of three main sectors-. government, households, and foreign trade. Households are the consumers who own factors of production, firms are the producers that use these factors to produce goods and services, and the foreign trade sector represents international trade and transactions.

Question 2. In the three-sector model, the equilibrium condition occurs when

  1. Total consumption equals total savings
  2. Total income equals total consumption
  3. Total income equals total expenditure
  4. Total savings equals total investment

Answer: 3. Total income equals total expenditure

Explanation:

In the three-sector model, the equilibrium condition occurs when total income (Y) equals total expenditure (C + I + G + NX), where C is consumption expenditure, I is investment expenditure, G is government expenditure, and NX is net exports (exports minus imports).

Question 3. The formula for calculating the equilibrium level of income (Y) in the three-sector model is

  1. Y = C + I + G
  2. Y = C + S + T
  3. Y = C + I + NX
  4. Y = C + I – NX

Answer: 3. Y = C + I + NX

Explanation:

In the thnee-sector model, the formula forcalculating the equilibrium level of income (Y) is Y = C + I + NX, where C is consumption expenditure, I is investment expenditure, and NX is net exports (exports minus imports).

Question 4. If in the three-sector model, total consumption is ? 800 million, total investment is ? 200 million, government expenditure is ? 300 million, and net exports are ? 50 million, the equilibrium level of income (Y) would be

  1. ₹ 1.050 million
  2. ₹ 1,250 million
  3. ₹ 750 million
  4. ₹1,350 million

Answer: 2. ₹ 1,250 million

Explanation:

To calculate the equilibrium level of income (Y), we use the formula Y = C + I + NX. Substituting the given values: Y = ₹  800 million (consumption) + ₹  200 million (investment) + ₹ 50 million (net exports) = ₹ 1,050 million.

Question 5. If in the three-sector model, total consumption is ₹ 500 million, total investment is ? 300 million, government expenditure is ₹ 200 million, and net exports are ₹ 50 million (trade deficit), the equilibrium level of income (Y) would be

  1. ₹ 1,050 million
  2. ₹ 950 million
  3. ₹ 750 million
  4. ₹ 1,150 million

Answer: 2. ₹ 950 million

Explanation:

To calculate the equilibrium level of income (Y), we use the formula Y = C + I + NX.

Substituting the given values: Y = ₹ 500 million (consumption) + ₹ 300 million (investment) -₹  50 million (net exports) = ₹ 950 million.

Question 6. In a three-sector model, the three main sectors of the economy are

  1. Households, firms, and government
  2. Households, firms, and foreign trade
  3. Households, firms, and banks
  4. Households, firms, and financial institutions

Answer: 2. Households, firms, and foreign trade

Explanation:

In a three-sector model, the economy consists of three main sectors – households, firms (businesses), and foreign trade. Households are the consumers, firms produce goods and services, and foreign trade represents international transactions.

Question 7. In a three-sector model, the equilibrium condition occurs when

  1. Aggregate savings equal aggregate investment
  2. Aggregate consumption equals aggregate income
  3. Total exports equal total imports
  4. Total government spending equals total tax revenue

Answer: 2. Aggregate consumption equals aggregate income

Explanation:

In a three-sector model, the equilibrium condition occurs when aggregate consumption (C) equals aggregate income (Y). At equilibrium, total income earned in the economy is either consumed, saved, or spent on imports.

Question 8. If, in the three-sector model, aggregate consumption is greater than aggregate income, the economy is in

  1. Recession
  2. Equilibrium
  3. Inflation
  4. A trade surplus

Answer: 1. Recession

Explanation:

If aggregate consumption (C) is greater than aggregate income (Y) in the three-sector model, it means that households are spending more than their income, which can lead to decreased savings and economic f slowdown, often associated with a recession.

Question 9. The formula for calculating the equilibrium level of income (Y) in a three-sector model is

  1. Y = C -1 + X – M
  2. Y = C + I + G
  3. Y = C + S + T
  4. Y = C + I + X

Answer: 2. Y = C + I + G

Explanation:

In a three-sector model with government (G) included, the formula for calculating the equilibrium level of income (Y) is Y = C + I + G. This equation represents total consumption, investment, and government spending.

Question 10. The concept of the marginal propensity to import (MPM) in a three-sector model refers to

  1. The change in government spending due to changes in income.
  2. The change in consumption due to changes in income.
  3. The change in imports due to changes in income.
  4. The change in investment due to changes in interest rates.

Answer: 3. The change in imports due to changes in income.

Explanation:

The concept of the marginal propensity to import (MPM) in a three-sector model refers to the change in imports due to changes in income. It represents the fraction of additional income that is spent on imports.

Question 11. The formula for calculating national income (Y) in the three-sector model is

  1. Y = C + S
  2. Y = C + I
  3. Y = C + T
  4. Y = C + T + I

Answer: 4. Y = C + T + I

Explanation:

In the three-sector model, national income (Y) is equal to consumption expenditure (C) plus taxes (T) plus investment (I). This is because all income earned by households is either consumed, saved, or paid in taxes and investment adds to the total income.

Question 12. In the three-sector model, the total income earned by households is divided into three components: consumption expenditure (C), savings (S), and

  1. Taxes (T)
  2. Investment (I)
  3. Exports (X)
  4. Government expenditure (G)

Answer: 1. Taxes

Explanation:

In the three-sector model, the total income earned by households is divided into three components: consumption expenditure (C), savings (S), and taxes (T). The income that is not spent on consumption or saved is paid in taxes.

Question 13. The equilibrium condition in the three-sector model occurs when:

  1. Total consumption equals total income
  2. Total savings equal total investment
  3. Total consumption plus total taxes equal total income
  4. Total exports equal total imports

Answer: 3. Total consumption plus total taxes equal total income

Explanation:

The equilibrium condition in the three-sector model occurs when total consumption (C) plus total taxes (T) equal total income (Y). At equilibrium, the total income generated in the economy is either consumed, saved, or paid in taxes.

Question 14. If, in the three-sector model, aggregate consumption and taxes are greater than aggregate income, it indicates that

  1. The economy is in equilibrium
  2. The economy is in recession
  3. The economy is facing a surplus
  4. The economy is facing a deficit

Answer:  4. The economy is facing a deficit

Explanation:

If aggregate consumption (C) and taxes (T) are greater than aggregate income (Y) in the three-sector model, it indicates that the economy is facing a deficit. This means that households are consuming and paying more in taxes than what they earn as income.

Question 15. In a three-sector model of national income determination, the three main sectors are

  1. Household, government, and foreign trade
  2. Household, business, and government
  3. Business, government, and foreign trade
  4. Household, financial, and foreign trade

Answer: 2. Household, business, and government

Question 16. The three-sector model expands the two-sector model by incorporating he role of

  1. Government and imports only
  2. Government and exports only
  3. Government and both imports and exports
  4. Foreign trade and exports only

Answer: 3. Government and both imports and exports

Question 17. In the three-sector model, government spending includes

  1. Imports and exports of goods and services
  2. Taxes and transfers to households
  3. Investments in physical capital by businesses
  4. Savings and financial investments

Answer: 2. Taxes and transfers to households

Question 18. Equilibrium income in the three-sector model is achieved when

  1. Aggregate demand is greater than aggregate supply
  2. Aggregate demand is less than aggregate supply
  3. Aggregate demand is equal to aggregate supply
  4. Aggregate demand is equal to consumption

Answer: 3. Aggregate demand is equal to aggregate supply

Question 19. The equilibrium condition in the three-sector model is represented as

  1. Aggregate demand (AD) = Exports (X) + Government spending (G)
  2. Aggregate demand (AD) = Consumption (C) + Government spending (G) + Savings (S) .
  3. Aggregate demand (AD) = Consumption (C) + Investment (I) + Government spending (G)
  4. Aggregate demand (AD) = Consumption (C) + Investment (I) + Government spending (G) – Imports (M)

Answer: 3. Aggregate demand (AD) = Consumption (C) + Investment (I) + Government spending (G)

Question 20. In the three-sector model, leakage refers to

  1. Money flowing into the economy due to exports
  2. Money flowing out of the economy due to imports
  3. Taxes and savings that reduce the flow of income
  4. Government spending that increases the flow of income

Answer: 3. Taxes and savings that reduce the flow of income

Question 21. The injection in the three-sector model refers to

  1. Money flowing out of the economy due to imports
  2. Money flowing into the economy due to exports
  3. Government spending and investments that increase the flow of income
  4. Savings and taxes that reduce the flow of income

Answer: 3. Government spending and investments that increase the flow of income

Question 22. In the three-sector model, if aggregate demand exceeds aggregate supply it leads to

  1. A surplus in the economy
  2. An increase in government borrowing
  3. Inflationary pressures in the economy
  4. A decrease in national income

Answer: 3. A decrease in national income

The Government Sector And Income Determination

Question 1. In an economy, the government purchases of goods and services (G) are ₹ 500 billion, and taxes (T) are? 300 billion, transfer payments (TR) are ₹ 100 billion, and the disposable income (YD) is ₹ 1,500 billion. Calculate the level of government savings or dissavings.

  1. Government savings of ₹  200 billion
  2. Government dissavings of ₹ 100 billion
  3. Government dissavings of ₹  200 billion
  4. Government savings of ₹ 100 billion

Answer: 3. Government dissavings of ₹ 200 billion

Solution:

Government savings or dissavings can be calculated using the formula:

Government Savings (or Dissavings) = Taxes (T) – Transfer Payments (TR) – Government Purchases (G)

Government Savings (or Dissavings) = ₹ 300 billion ₹ 100 billion ₹ 500 billion

Government Savings (or Dissavings) = ₹ 300 billion – ₹ 600 billion

Government Savings (or Dissavings) = -₹ 300 billion Since the result is negative, it indicates that the government is running a dissavings or deficit of ₹ 200 billion.

Question 2. In an economy, the government increases its spending on infrastructure projects and welfare programs. As a result, the government expenditure (G) increases by ₹ 100 billion. How will this increase in government expenditure affect the equilibrium level of income in the economy, assuming the marginal propensity to consume (MPC) is 0.8?

  1. The equilibrium level of income will increase by ₹ 100 billion.
  2. The equilibrium level of income will decrease by ₹ 100 billion.
  3. The equilibrium level of income will increase by ₹ 500 billion.
  4. The equilibrium level of income will decrease by ₹ 500 billion.

Answer: 4. The equilibrium level of income will increase by ₹ 500 billion.

Solution:

The increase in government expenditure will directly contribute to the aggregate demand (AD) in the economy. The change in equilibrium income (AY) can be calculated using the expenditure multiplier (k), which is given by:

k = 1 / (1 – MPC) where

MPC is the marginal propensity to consume. In this case,.the MPC is 0.8, so the expenditure multiplier is:

k = 1 / (1 -0.8)

= 1 / 0.2 = 5

Now, we can calculate the change in equilibrium income (AY) using the expenditure multiplier:

ΔY =  × ΔG

ΔY = 5 × ₹ 100 billion

ΔY = ₹ 500 billion

So, the increase in government expenditure by ₹100 billion will lead to an increase in the equilibrium level of income by ₹ 500 billion.

Question  3. In an economy, the government increases its spending on infrastructure projects and welfare programs. As a result, the government expenditure (G) increases by X 200 billion. How will this increase in government expenditure affect the equilibrium level of income (Y) in the economy, assuming a simple Keynesian model? «

  1. The equilibrium level of income (Y) will increase by X 200 billion.
  2. The equilibrium level of income (Y) will decrease by X 200 billion.
  3. The equilibrium level of income (Y) will not change. .
  4. The equilibrium level of income (Y) will change, but the direction of change cannot be determined without more information.

Answer: 1. The equilibrium level of income (Y) will increase by X 200 billion.

Solution:

In a simple Keynesian model, an increase in government expenditure (G) will have a multiplier effect on the equilibrium level of income (Y). The multiplier effect arises because an increase in government expenditure leads to an increase in aggregate demand, which in turn leads to an increase in production and income.

The formula for the multiplier effect is given by:

Multiplier =1/(1 – MP(c)

Where MPC is the marginal propensity to consume.

Since the question doesn’t provide the value of MPC, we assume that MPC is 0.8 (which means that 80% of any increase in income will be. consume (d).

With MPC = 0.8, the multiplier will be:

Multiplier*1 / (1 -0.8) = 1 /0.2 = 5

Now, if the government increases its expenditure (G) by X 200 billion, the increase in income (Y) will be:

Increase in income (Y) = Multiplier* Increase in government expenditure (G)

Increase in income (Y) = 5 × ₹ 200 billion = ₹ 1,000 billion

So, the equilibrium level of income (Y) will increase by ₹ 200 billion due to the increase in government expenditure.

Question 4. In an economy, the government purchases (G) are ₹ 500 billion, taxes (T) are ₹ 300 billion, transfer payments (TR) are ₹ 100 billion, and the disposable income (YD) is ₹ 1,800 billion. Calculate the level of government savings or dissavings (Sg).

  1. Government savings (Sg) = ₹ 100 billion
  2. Government savings (Sg) = – ₹ 100 billion
  3. Government savings (Sg) = ₹ 300 billion
  4. Government savings (Sg) = – ₹  300 billion

Answer: 2. Government savings (Sg) = – ₹ 100 billion

Solution:

Government savings or dissavings (Sg) can be calculated using the formula

Sg = (T + TR) – G

Sg = (₹ 300 billion + ₹ 100 billion) – ₹ 500 billion

Sg = ₹ 400 billion – ₹ 500 billion Sg = -₹ 100 billion

Since the result is negative, it indicates that the government is running a deficit or dissaving of X 100 billion.

So, the correct answer is  Government savings (Sg) = -X 100 billion.

Determination Of Equilibrium Income Four-Sector Model

Question 1. In the four-sector model, the total income earned by households is divided into four components: consumption expenditure (C), savings (S), taxes (T), and

  1. Exports (X)
  2. Imports (M)
  3. Investment (I)
  4. Government expenditure (G)

Answer: 3. Investment (I)

Explanation:

In the four-sector model, the total income earned by households is divided into four components: consumption expenditure (C), savings (S), taxes (T), and investment (I). Investment represents the amount businesses invest in new capital goods.

Question 2. The equilibrium condition in the four-sector model occurs when

  1. Total consumption equals total income
  2. Total savings equal total investment
  3. Total consumption plus total taxes equal total income
  4. Total exports equal total imports

Answer: 3. Total consumption plus total taxes equal total income

Explanation:

The equilibrium condition in the four-sector model occurs when total consumption (C) plus total taxes (T) equals total income (Y). At equilibrium, the total income generated in the economy is either consumed, saved, paid in taxes, or invested.

Question 3. If, in the four-sector model, aggregate consumption and taxes are greater than aggregate income, it indicates that

  1. The economy is in equilibrium
  2. The economy is in recession
  3. The economy is facing a surplus
  4. The economy is facing a deficit

Answer: 4. The economy is facing a deficit

Explanation:

If aggregate consumption (C) and taxes (T) are greater than aggregate income (Y) in the four-sector model, it indicates that the economy is facing a deficit. This means that households are consuming and paying more in taxes than what they earn as income.

Question 4. In the four-sector model, the net exports (NX) component represents

  1. Total consumption by households
  2. Total government expenditure
  3. Total investment by firms.
  4. The difference between exports (X) and imports (M)

Answer: 4. The difference between exports (X) and imports (M)

Explanation:

In the four-sector model, the net exports (NX) component represents the difference between exports (X) and imports (M). If exports exceed imports

(NX > 0), the economy has a trade surplus, and if imports exceed exports (NX < 0), the economy has a trade deficit.

Question 5. The formula for calculating national income (Y) in the four-sector model is

  1. Y = C + S
  2. Y = C + T
  3. Y = C + T + I
  4. Y = C + T + I + NX

Answer: 4. Y = C + T + I + NX

Explanation:

In the four-sector model, national income (Y) is equal to consumption expenditure (C) plus taxes (T) plus investment (I) plus net exports (NX). This formula accounts for all the components that determine the total income earned in the economy.

Question 6. In the four-sector model, the four main sectors of the economy are

  1. Households, firms (businesses), government, and foreign trade
  2. Households, firms (businesses), government, and financial institutions
  3. Households, firms (businesses), government, and banks
  4. Households, firms (businesses), government, and central bank

Answer: 1. Households, firms (businesses), government, and foreign trade

Explanation:

In the four-sector model, the economy consists of four main sectors – households, firms ‘(businesses), government, and foreign trade. Households are the consumers, firms are the producers, the government represents public expenditure, and foreign trade represents international transactions.

Question 7. In the four-sector model, the total income earned by households is divided into four components: consumption expenditure ((c), savings (S), taxes (T), and

  1. Imports (M)
  2. Exports (X)
  3. Government expenditure (G)
  4. Investments (I)

Answer: 2. Exports (X)

Explanation:

In. the four-sector model, the total income earned by households is divided into four components: consumption expenditure (C), savings (S), taxes (T), and exports (X). Exports represent the income earned from ‘ foreign trade.

Question 8. The equilibrium condition in the four-sector model occurs when

  1. Total consumption plus total taxes equal total income
  2. Total consumption plus total investment equal total income
  3. Total savings plus total investment equals total income
  4. Total exports equal total imports

Answer: 1. Total savings plus total investment equal total income

Explanation:

The equilibrium condition in the four-sector model occurs when total savings (S) plus total investment (I) equals total income (Y). At equilibrium, the total income generated in the economy is either consumed, saved, or invested.

Question 9. If, in the four-sector model, aggregate consumption, taxes, and imports are greater than aggregate income, it indicates that

  1. The economy is in equilibrium
  2. The economy is in recession
  3. The economy is facing a surplus
  4. The economy is facing a deficit

Answer: 4. The economy is facing a deficit

Explanation:

If aggregate consumption (C), taxes (T), and imports (M) are greater than aggregate income (Y) in the four-sector model, it indicates that the economy is facing a deficit. This means that households are consuming, paying taxes, and importing more than what they earn as income.

Question 10. The formula for calculating national income (Y) in the four-sector model is: 

  1. Y = C + S
  2. Y = C + I ,
  3. Y = C + T + X
  4. Y = C + T + I + X – M

Answer: 4. Y = C + T + I + X- M

Explanation:

In the four-sector model, national income (Y) is equal to consumption expenditure (C) plus taxes (T) plus investment (I) plus exports (X) minus imports (M). This formula accounts for all components of income and expenditure in the economy.

Question 11. In a four-sector model of national income determination, the four main sectors are

  1. Household, government, business, and foreign trade.
  2. Household, government, business, and financial
  3. Household, government, business, and exports
  4. Business, government, foreign trade, and financial

Answer: 1. Household, government, business, and foreign trade.

Question 12. The four-sector model expands the three-sector model by incorporating the role of

  1. Government and imports only
  2. Government and exports only
  3. Foreign trade and exports only
  4. The financial sector and imports only

Answer: 1. Government and imports only

Question 13. In the four-sector model, net exports (NX) represent the difference between

  1. Government spending (G) and taxes (T)
  2. Exports (X) and imports (M)
  3. Savings (S) and investments
  4. Consumption (C) and investment (I)

Answer: 2. Exports (X) and imports (M)

Question 14. Equilibrium income in the four-sector model is achieved when

  1. Aggregate demand is greater than aggregate supply
  2. Aggregate demand is less than aggregate supply
  3. Aggregate demand is equal to aggregate supply
  4. Aggregate demand is equal to consumption

Answer: 3. Aggregate demand is equal to aggregate supply

Question 15. The equilibrium condition in the four-sector model is represented as:

  1. Aggregate demand (AD) = Consumption (C) + Government spending (G) + Savings (S)
  2. Aggregate demand (AD) = Consumption (C) + Investment (I) + Government spending (G) + Net exports (NX)
  3. Aggregate demand (AD) = Consumption (C) + Investment (I) + Government spending (G) – Net exports (NX)
  4. Aggregate demand (AD) = Consumption (C) + Investment (I) + Government spending (G) – Taxes (T)

Answer: 2. Aggregate demand (AD) = Consumption (C) + Investment (I) + Government spending (G) + Net exports (NX)

Question 16. In the four-sector model, the net exports (NX) are negative when

  1. Imports exceed exports
  2. Exports exceed imports
  3. Government spending exceeds taxes
  4. Savings exceed investments

Answer:  1. Imports exceed exports

Question 17. The leakage in the four-sector model refers to

  1. Money flowing into the economy due to exports ,
  2. Money flowing out of the economy due to imports
  3. Taxes, savings, and imports that reduce the flow of income
  4. Government spending and investments that increase the flow of income

Answer: 3. Taxes, savings, and imports that reduce the flow of income

Question 18. The injection in the four-sector model refers to

  1. Money flowing out of the economy due to imports
  2. Money flowing into the economy due to exports
  3. Government spending, exports, and investments that increase the flow of income
  4. Taxes, savings, and imports that reduce the flow of income

Answer: 3. Government spending, exports, and investments that increase the flow of income

Conclusion

Question 1. According to the Keynesian theory, during an economic recession, the government should

  1. Decrease government spending to reduce budget deficits.
  2. Increase taxes to control inflation.
  3. Increase government spending to stimulate aggregate demand.
  4. Decrease interest rates to encourage private investment.

Answer: 3. Increase government spending to stimulate aggregate demand.

Explanation:

According to the Keynesian theory, during an economic recession, the government should increase government spending to stimulate aggregate demand. This increase in government expenditure will help boost economic activity and create demand for goods and services, leading to higher employment and economic growth.

Question 2. The Keynesian theory emphasizes that in times of economic downturns, the primary cause of unemployment is

  1. Technological advancements lead to job losses.
  2. Structural changes in the economy.
  3. Insufficient aggregate demand.
  4. Excessive government intervention.

Answer: 3. Insufficient aggregate demand.

Explanation:

The Keynesian theory emphasizes that in times of economic downturns, the primary cause of unemployment is insufficient aggregate demand. When overall demand for goods and services is low, firms reduce production and lay off workers, leading to higher unemployment.

Question 3. The concept of the “Multiplier Effect” in the Keynesian theory suggests that

  1. Government spending has a larger impact on national income than changes in taxes.
  2. A change in investment leads to a proportionate change in national income.
  3. Increases in exports result in higher economic growth and employment.
  4. Changes in consumption have a direct and immediate impact on investment.

Answer:  2. A change in investment leads to a proportionate change in national income.

Explanation:

The concept of the “Multiplier Effect” in the Keynesian theory suggests that a change in investment leads to a proportionate change in national income. It demonstrates how an initial change in investment can set off a chain reaction of increased spending, leading to a larger overall impact on national income.

Question 4. According to the Keynesian theory, during periods of high inflation, the government should focus on

  1. Increasing government spending to boost aggregate demand
  2. Reducing taxes to encourage consumption.
  3. Decreasing money supply and raising interest rates to control spending.
  4. Encouraging private investment through tax incentives.

Answer: 3. Decreasing money supply and raising interest rates to control spending

Explanation:

According to the Keynesian theory, during periods of high inflation, the government should focus on decreasing the money supply and raising interest rates to control spending. These measures help to reduce aggregate demand, curb inflationary pressures, and stabilize the economy.

Question 5. The Keynesian theory highlights that during economic downturns, there may be a role for the government to engage in

  1. Active fiscal and monetary policies to stabilize the economy.
  2. Laissez-faire and minimal government intervention.
  3. Decreasing public expenditure to reduce budget deficits.
  4. Reducing public debt to promote economic growth.

Answer: 1. Active fiscal and monetary policies to stabilize the economy.

Explanation:

The Keynesian theory highlights that during economic downturns, there may be a role for the government to engage in active fiscal and monetary policies to stabilize the economy. These policies involve adjustments in government spending, taxation, and money supply to address fluctuations in aggregate demand and promote economic stability.

Question 6. The conclusion of the Keynesian theory of the determination of national income is that

  1. The government should play a minimal role in the economy.
  2. Government intervention is necessary to stabilize the economy and achieve full employment.
  3. The economy will always be in a state of equilibrium without any government intervention.
  4. Monetary policy is the most effective tool to control inflation and f unemployment

Answer: 2. Government intervention is necessary to stabilize the economy and achieve full employment.

Explanation:

The Keynesian theory concludes that during periods of economic downturns, the government should use fiscal policy (government spending and taxation) to stimulate aggregate demand and stabilize the economy. By increasing government spending during recessions, the k government can create more jobs and boost economic activity to achieve full employment.

Question 7. According to the Keynesian theory, during times of economic recession, the government should: ‘

  1. Decrease taxes to boost consumer spending.
  2. Decrease government spending to reduce budget deficits.
  3. Increase taxes to reduce inflation.
  4. Increase government spending to stimulate aggregate demand.

Answer: 4. Increase government spending to stimulate aggregate demand.

Explanation:

During times of economic recession, the Keynesian theory recommends that the government should increase its spending to stimulate aggregate demand. This increased government spending will create more jobs, boost consumer spending, and help the economy recover from the recession.

Question 8. The Keynesian theory suggests that changes in aggregate demand can lead to fluctuations in:

  1. The exchange rate.
  2. Interest rates
  3. Unemployment and inflation.
  4. Stock market prices.

Answer: 3. Unemployment and inflation.

Explanation:

The Keynesian theory highlights that changes in aggregate demand can lead to fluctuations in unemployment and inflation. During periods of low aggregate demand, there is a risk of higher unemployment, and during periods of high aggregate demand, there is a risk of inflationary pressures.

Question 9. The primary focus of the Keynesian theory is on

  1. Long-term economic growth.
  2. Achieving price stability.
  3. Short-run economic fluctuations and stabilizing the economy.
  4. Increasing international trade.

Answer: 3. Short-run economic fluctuations and stabilizing the economy.

Explanation:

The -Keynesian theory primarily focuses on short-run economic fluctuations and how to stabilize the economy during periods of • recession or depression. It emphasizes the importance of government intervention to achieve full employment and economic stability.

Question 10. The Keynesian theory influenced the development of economic policies during

  1. The Great Depression in the 1930s.
  2. The Industrial Revolution in the 18th century.
  3. The Renaissance period in Europe.
  4. The post-World War II era.

Answer: 1. The Great Depression in the 1930s.

Explanation:

The Keynesian theory gained prominence during the Great Depression in the 1930s when John Maynard Keynes published his seminal work, “The General Theory of Employment, Interest, and Money.” It had a significant impact on economic policies aimed at addressing the economic challenges of the Great Depression.

Question 11. The Keynesian theory emphasizes the role of in influencing national income.

  1. Aggregate supply
  2. Government policies
  3. Foreign trade
  4. Business investments

Answer: 2. Government policies

Question 12. According to the Keynesian theory, during periods of economic downturns, the government should use it to stimulate economic growth. ,

  1. Monetary policy
  2. Supply-side policies
  3. Fiscal policy
  4. Trade policies

Answer: 3. Fiscal policy

Question 13. The concept of “effective demand” in the Keynesian theory highlights the importance of

  1. Government spending on infrastructure projects
  2. The total demand for goods and services in the economy
  3. The level of savings and investments in the economy
  4. The role of foreign trade in influencing national income

Answer: 2. The total demand for goods and services in the economy

Question 14. The Keynesian theory suggests that if there is insufficient aggregate demand in the economy, the government should

  1. Reduce government spending and lower taxes
  2. Increase government spending and lower taxes
  3. Increase interest rates to encourage savings
  4. Decrease interest rates to promote borrowing and investment

Answer: 2. Increase government spending and lower taxes

Question 15. In the Keynesian model, full employment equilibrium can only be ‘ achieved with

  1. An increase in government regulations and control
  2. The proper functioning of the financial sector
  3. The active role of the government in managing aggregate demand
  4. A balanced budget and reduced government intervention

Answer: 3. The active role of the government in managing aggregate demand

Question 16. The Keynesian theory gained popularity during the

  1. Great Depression of the 1930s
  2. Industrial Revolution of the 18th century
  3. Renaissance era in Europe
  4. Dot-com bubble of the late 1990s

Answer: 1. Great Depression of the 1930s

Question 17. Keynes argued that in the long run

  1. Government intervention is unnecessary in the economy
  2. Supply creates its demand
  3. The economy will automatically reach full employment
  4. The impact of government policies on aggregate demand diminishes

Answer: 4. The impact of government policies on aggregate demand diminishes

Question  18. The Keynesian theory’s focus on aggregate demand and government intervention has had a significant influence on the development of modern

  1. Classical economics
  2. Monetarist economics
  3. Neoclassical economic
  4. Macroeconomics

Answer: 4. Macroeconomics

CA Foundation Economics – National Income Accounting Multiple Choice Questions

CA Foundation Economics – National Income Accounting Multiple Choice Questions

Question 1. Which of the following is NOT a component of Gross Domestic Product (GDP)?

  1. Consumption
  2. Investment
  3. Government Spending
  4. Imports

Answer: 4. Imports

Explanation:

Imports are not included in Gross Domestic Product (GDP) calculations because GDP measures the value of goods and services produced within a country’s borders. Importing goods from other countries is not considered part of a country’s production.

Question 2. Which of the following is the correct formula for calculating Gross Domestic Product (GDP)?

  1. GDP = Consumption + Investment + Government Spending
  2. GDP = Consumption + Investment + Government Spending + Exports – Imports
  3. GDP = Consumption + Investment + Net Exports
  4. GDP = Consumption + Investment + Government Spending + Exports

Answer: 2. GDP = Consumption + Investment + Government Spending + Exports – Imports

Explanation:

This formula represents the expenditure approach to calculating GDP, taking into account consumption, investment, government spending, and net exports (exports minus imports).

Question 3. Which of the following is a measure of a country’s Gross National Product (GNP)?

  1. The total value of all goods and services produced within a country’s borders in a specific period.
  2. The total value of all goods and services produced by a country’s residents, both domestically and abroad, in a specific period.
  3. The total value of all goods and services sold by a country to other countries in a specific period.
  4. The total value of all goods and services produced by a country’s domestic companies in a specific period.

Answer: 2. The total value of all goods and services produced by a country’s residents, both domestically and abroad, in a specific period.

Explanation:

Gross National Product (GNP) measures the total value of all goods and services produced by a country’s residents, regardless of whether they are located within the country’s borders or abroad.

Question 4. In national income accounting, “Net Domestic Product (NDP)” is defined as

  1. The total value of all goods and services produced within a country’s borders in a specific period.
  2. The total value of all final goods and services produced within a country’s borders in a specific period.
  3. The total value of all goods and services produced within a country’s borders minus depreciation in a specific period.
  4. The total value of all goods and services produced by a country’s residents, both domestically and abroad, in a specific period. .

Answer: 3. The total value of all goods and services produced within a country’s borders minus depreciation in a specific period

Explanation:

Net Domestic Product (NDP) is a measure of a country’s economic output that considers depreciation (wear and tear on capital goods) to account for the difference between Gross Domestic Product (GDP) and the net value of capital goods used in the production process.

Question 5. Which of the following is NOT a component of Gross Domestic Product (GDP)?

  1. Government Spending.
  2. Consumption
  3. Investment
  4. Imports

Answer: 4. Imports

Explanation:

GDP only considers the value of goods and services produced within a country’s borders (domestic production). Imports represent goods and services produced abroad, and they are not included in GDP calculations.

Question 6. What does GNP stand for in national income accounting?

  1. Gross National Product
  2. Gross Net Profit
  3. Government National Payment
  4. General National Practice

Answer: 1. Gross National Product

Explanation:

GNP stands for Gross National Product, which measures the total value of goods and services produced by a country’s residents (both domestically and abroad) during a specific period.

Question 7. Which of the following represents the formula for calculating GDP (Gross Domestic Product)?

  1. GDP = Consumption + Government Spending + Investment + Exports – Imports
  2. GDP = Consumption + Government Spending – Investment + Exports + Imports
  3. GDP = Consumption + Government Spending + Investment – Exports – Imports
  4. GDP = Consumption – Government Spending + Investment + Exports – Imports

Answer: 1. GDP = Consumption + Government Spending + Investment + Exports – Imports

Explanation:

GDP is calculated by summing up the consumption by households, government spending, investments made by businesses, and net exports (exports minus imports).

Question 8. In national income accounting, what does the term “disposable income” refer to?

  1. The total income earned by a nation’s residents.
  2. The income that individuals have after paying taxes.
  3. The total income earned by a nation’s residents minus government spending.
  4. The income earned from foreign sources.

Answer: 2. The income that individuals have after paying taxes.

Explanation:

Disposable income refers to the income that individuals have at their disposal after paying taxes. It is the money available for personal spending, saving, or investment.

Question 9. Which of the following is NOT included in the calculation of Gross Domestic Product (GDP)?

  1. Government spending
  2. Consumer spending
  3. Imports
  4. Exports

Answer: 3. Imports

Explanation:

GDP is a measure of the total economic output of a country. It includes consumer spending, government spending, and exports (goods and services produced domestically and sold abroad). However, imports (goods and services produced abroad and sold domestically) are not included in GDP because they are already accounted for in the final sales of domestic goods and services.

Question 10. Which of the following is used to measure the total income earned by a country’s residents, regardless of their location?

  1. Gross National Product (GNP)
  2. Gross Domestic Product (GDP)
  3. Net National Product (NNP)
  4. Net Domestic Product (NDP)

Answer: 1. Gross National Product (GNP)

Explanation:

GNP measures the total income earned by a country’s residents, including income earned abroad. It includes the income earned domestically and the net income earned from foreign assets and investments. In contrast, GDP measures the total economic output within a country’s borders, regardless of whether the income is earned by residents or foreigners.

Question 11. In National Income Accounting, depreciation of capital refers to

  1. The decrease in the value of a nation’s currency.
  2. The decrease in the value of physical assets over time
  3. The decrease in the government’s budget deficit
  4. The decrease in consumer spending on durable goods

Answer: 2. The decrease in the value of physical assets over time

Explanation:

Depreciation of capital in National Income Accounting refers to the wear and tear or obsolescence of physical assets (For example, machinery, and buildings) used in the production process. It is also known as “capital consumption” or “capital depreciation.” Depreciation is deducted from the Gross Domestic Product (GDP) to arrive at the Net Domestic Product (NDP) or from the Gross National Product (GNP) to arrive at the Net National Product (NNP).

Question 12. Which of the following is an example of a transfer payment in National Income Accounting?

  1. Salary of a government employee
  2. Social Security benefits
  3. Income earned from selling goods
  4. Corporate taxes paid to the government

Answer: 2. Social Security benefits

Explanation:

Transfer payments are payments made by the government to individuals or other entities where no goods or services are exchanged. Social Security benefits are an example of transfer payments as they involve direct payments from the government to eligible recipients without any production of goods or services in return.

Question 13. Which of the following is NOT a component of Aggregate Expenditure in National Income Accounting?

  1. Consumption
  2. Investment (I)
  3. Government Spending (G)
  4. Net Exports (NX)

Answer: 4. Net Exports (NX)

Explanation:

Aggregate Expenditure is the total spending on goods and services in an economy. It comprises four components: Consumption (C), investor (I), Government Spending (G), and Net Exports (NX). Net Exports (NX represents the difference between exports (X) and imports (M) and are not a standalone component of Aggregate Expenditure

Question 14. National income accounting is a method used to

  1. Calculate the total profits of private companies
  2. Measure the economic performance of a country
  3. Determine the total savings of the government
  4. Assess the inflation rate in the economy

Answer: 2. Measure the economic performance of a country

Question 15. Gross Domestic Product (GDP) is defined as: 

  1. The total value of all goods and services produced within a country’s borders in a specific period
  2. The total value of all imports and exports of a country
  3. The total value of all goods and services produced by a country’s citizens, regardless of their location
  4. The total value of all goods and services produced by a country’s companies, regardless of their ownership

Answer: 1. The total value of all goods and services produced within a country’s borders in a specific period

Question 16. Which of the following is NOT included in GDP calculations? 

  1. Investment spending by businesses
  2. Government spending on infrastructure
  3. Social Security payments to retirees
  4. Consumer spending on durable goods

Answer: 3. Social Security payments to retirees

Question 17. The income approach to calculating GDP

  1. Adds up all the wages, salaries, and profits earned in an economy
  2. Only considers the total spending on final goods and services
  3. Focuses on the net exports of a country
  4. Includes only the value of intermediate goods and services

Answer: 1. Adds up all the wages, salaries, and profits earned in an economy

Question 18. Real GDP differs from Nominal GDP in that

  1. Real GDP accounts for inflation, while Nominal GDP does not
  2. Real GDP includes government spending, while Nominal GDP does not
  3. Real GDP is measured in current market prices, while Nominal GDP is adjusted for inflation
  4. Real GDP considers only the value of goods, while Nominal GDP includes services as well

Answer: 1. Real GDP accounts for inflation, while Nominal GDP does not

Question 19. National Income is calculated as

  1. GDP minus depreciation
  2. GDP plus net exports
  3. GDP minus indirect taxes and subsidies
  4. GDP minus government spending

Answer: 3. GDP minus indirect taxes and subsidies

Question 20. The expenditure approach to calculating GDP

  1. Adds up all the wages, salaries, and profits earned in an economy
  2. Focuses on the total spending on final goods and services
  3. Includes only the value of intermediate goods and services
  4. Considers the net exports of a country

Answer: 2. Focuses on the total spending on final goods and services

Question 21. Which of the following is a component of Gross Domestic Product (GDP)?

  1. Money supply in the economy
  2. Unemployment rate
  3. Government budget deficit
  4. Investment spending by businesses

Answer: 4. Investment spending by businesses

Usefulness And Significance Of National Income Estimates

Question 1. National Income estimates are essential for

  1. Calculating government debt
  2. Evaluating the overall health of the financial sector
  3. Measuring the economic growth and development of a country
  4. Determining the inflation rate

Answer: 3. Measuring the economic growth and development of a country

Explanation:

National Income estimates provide valuable information about the total output and income generated within an economy. By tracking changes in National Income over time, economists and policymakers can assess the economic growth and development of a country. It helps in understanding whether the economy is expanding or contracting and whether living standards are improving.

Question 2. The Gross Domestic Product (GDP) per capita is used to:

  1. Measure the overall size of the economy
  2. Determine the average income of a country’s citizens
  3. Calculate the total value of exports and imports
  4. Analyze the distribution Of wealth in a nation

Answer: 2. Determine the average income of a country’s citizens

Explanation:

GDP per capita is calculated by dividing the Gross Domestic Product (GDP) of a country by its population. It provides an estimate of the average income earned by each individual in the country. It is commonly used to compare the standard of living and economic well-being of different countries.

Question 3. Which of the following is NOT a usefulness of National Income estimates?

  1. Facilitating economic planning and formulation of policies
  2. Assessing the contribution of different sectors to the economy
  3. Aiding in international trade negotiations
  4. Estimating the unemployment rate

Answer: 4. Estimating the unemployment rate

Explanation:

National Income estimates provide valuable insights into various aspects of the economy, including economic growth, sectoral contributions, and international trade analysis. However, estimating the unemployment rate is not directly related to National Income accounting. Unemployment rate calculations involve separate labor market data and surveys.

Question 4. National Income estimates help in identifying

  1. The fiscal deficit of a country
  2. The sources of economic growth
  3. The exchange rates of foreign currencies
  4. The demographic profile of the population.

Answer: 2. The sources of economic growth

Explanation:

National Income estimates break down the total economic output into different sectors like agriculture, manufacturing, services, etc. By analyzing these sectoral contributions, economists can identify the sources of economic growth and determine which sectors are driving the overall expansion of the economy.

Question 5. The difference between Gross National Product (GNP) and Gross Domestic Product (GDP) is mainly due to

  1. Imports and exports
  2. Government spending
  3. Foreign aid received
  4. Remittances from citizens working abroad

Answer: 1. Imports and exports

Explanation:

The main difference between GNP and GDP lies in the treatment of net foreign income. GNP considers the total income earned by a country’s residents, regardless of their location (both domestic and abroad), while GDP only accounts for the income generated within the country’s borders.

Imports and exports are not included in GDP, but they are considered in the calculation of GNP to account for income earned from foreign trade and income earned by citizens working abroad.

Question 6. Which of the following is the usefulness of National Income estimates in economic planning?

  1. Estimating the number of people in poverty
  2. Determining the cost of living for citizens
  3. Assessing the impact of monetary policy
  4. Identifying the distribution of wealth in society

Answer: 3. Assessing the impact of monetary policy

Explanation:

National Income estimates are crucial for economic planning and policy formulation. One of the significant uses is in assessing the impact of monetary policy. By analyzing changes in National Income over time, policymakers can evaluate the effectiveness of monetary measures, such as interest rates and money supply, in influencing economic growth, inflation, and employment.

Question 7. Which of the following is NOT a significance of National Income estimates?

  1. Comparing the economic performance of different countries,
  2. Guiding businesses in profit maximization strategies
  3. Formulating fiscal policies and taxation rates
  4. Predicting short-term fluctuations in the stock market

Answer: 4. Predicting short-term fluctuations in the stock market

Explanation:

National Income estimates provide valuable information for various economic analyses and decision-making processes. However, they are not directly related to predicting short-term fluctuations in the stock market. Stock market movements are influenced by a wide range of factors, including investor sentiment, corporate earnings, geopolitical events, and macroeconomic indicators, but National Income alone is hot used for stock market predictions.

Question 8. The concept of “per capita income” derived from National Income estimates is used to

  1. Determine the total output of an economy
  2. Measure the average income of individuals in the country
  3. Assess the level of government debt
  4. Calculate the value of imports and exports

Answer: 2. Measure the average income of individuals in the country

Explanation:

“Per capita income” is calculated by dividing the total National Income of a country by its population. It provides an average income figure per person in the country. Per capita income is used to assess the standard of living, compare the economic prosperity of different nations, and understand the distribution of income among the population.

Question 9. National Income estimates help in identifying

  1. The number of foreign tourists visiting the country
  2. The contribution of different sectors to the economy
  3. The literacy rate and educational attainment of citizens
  4. The availability of natural resources within the country

Answer: 2. The contribution of different sectors to the economy

Explanation:

National Income estimates provide data on the total, output and value-added by different sectors of the economy, such as agriculture, manufacturing, services, etc. This information helps in understanding the relative importance and contribution of each sector to the overall economic activity in the country.

Question 10. National Income estimates are essential for

  1. Calculating individual income taxes
  2. Assessing the overall health of an economy
  3. Measuring inflation and unemployment rates
  4. Determining exchange rates between currencies

Answer: 2. Assessing the overall health of an economy

Question 11. National Income estimates are essential because they help in

  1. Calculating the total population of a country
  2. Measuring the total value of goods and services produced in a country
  3. Determining the exchange rate of the country’s currency
  4. Evaluating the literacy rate of the country

Answer: 2. Measuring the total value of goods and services produced in a country

Explanation:

National Income estimates are primarily used to measure the total value of goods and services produced within a country’s borders during a specific period. It is a key indicator of a country’s economic performance and is used to understand the overall economic activity and growth.

Question 12. The significance of National Income estimates lies in

  1. Assessing the distribution of income among different income groups
  2. Determining the number of unemployed individuals in the country
  3. Estimating the total national debt of the country
  4. Analyzing the birth and death rates in the country

Answer: 1. Assessing the distribution of income among different income groups

Explanation:

National Income estimates provide valuable information about the distribution of income among different sections of the population. It helps economists and policymakers understand the level of income inequality in the country and formulate appropriate policies to address disparities and promote inclusive growth.

Question 13. Which of the following is NOT a usefulness of National Income estimates?

  1. Assessing the standard of living in a country
  2. Formulating economic policies
  3. Calculating the inflation rate
  4. Comparing the economic performance of different countries

Answer: 3. Calculating the inflation rate

Explanation:

While National Income estimates are essential for various purposes, calculating the inflation rate is not one of them. Inflation is measured using other economic indicators, such as the Consumer Price Index (CPI) or Producer Price Index (PPI).

Question 14. National Income estimates help in international comparisons of countries’ economies because they:

  1. Provide information about the military strength of the countries
  2. Show the total exports and imports of the countries
  3. Indicate the level of technological advancement in the countries
  4. Offer a common measure to compare economic performance

Answer: 4. Offer a common measure to compare economic performance

Explanation:

National Income estimates provide a standardized measure that allows for meaningful comparisons of economic performance among different countries. GDP or GNP (Gross National Product) per capita is often used for these comparisons to understand the relative economic well-being of nations.

Question 15. Which of the following statements is true regarding the usefulness of National Income estimates?

  1. It helps in predicting the stock market trends.
  2. It assists in identifying the environmental challenges faced by a country. .
  3. It is only relevant for developed countries, not for developing countries.
  4. It aids in assessing the contribution of different sectors to the economy.

Answer: 4. It aids in assessing the contribution of different sectors to the economy.

Explanation:

National Income estimates help analyze the contributions of various sectors (such as agriculture, manufacturing, and services) to the overall economy. It allows policymakers to identify the strengths and weaknesses of different sectors and formulate strategies to promote balanced economic growth.

National Income estimates provide a comprehensive measure of the economic performance and health of a country. They help policymakers, economists, and analysts understand the level of economic activity, growth, and prosperity. By. analyzing National Income data, one can assess the overall health of an economy and make informed decisions regarding economic policies and development strategies.

Question 16. National income estimates are essential for

  1. Calculating the profits of individual companies
  2. Assessing the distribution of wealth in a country
  3. Determining the exchange rates between currencies
  4. Monitoring the stock market performance

Answer: 2. Assessing the distribution of wealth in a country

Question 17. The primary use of national income estimates is to

  1. Measure the overall happiness and well-being of citizens
  2. Determine the economic growth rate of the country
  3. Calculate the total value of imports and exports
  4. Evaluate the effectiveness of foreign aid programs

Answer: 2. Determine the economic growth rate of the country

Question 18. Why is it important to calculate Gross Domestic Product (GDP)?

  1. To understand the unemployment rate in the country
  2. To analyze the overall debt of the government
  3. To determine the total value of all goods and services produced in the economy
  4. To evaluate the efficiency of the banking sector

Answer: 3. To determine the total value of all goods and services produced in the economy

Question 19. National income estimates help in comparing the economic performance of different countries by

  1. Converting all currencies to a common unit of measurement
  2. Focusing solely on the GDP growth rate
  3. Ignoring the impact of inflation on the economy
  4. Excluding the service sector from the calculations

Answer: 1. Converting all currencies to a common unit of measurement

Question 20. The per capita income, derived from national income estimates, is useful for

  1. Understanding the total population of a country
  2. Analyzing the average income of individuals in the country
  3. Measuring the total number of employed people
  4. Evaluating the performance of the agricultural sector

Answer: 2. Analyzing the average income of individuals in the country

Question 21. One of the limitations of using national income estimates is that they

  1. Cannot account for the underground economy
  2. Overstate the value of intermediate goods
  3. Ignore the impact of international on the economy
  4. Focus excessively on government spending

Answer: 1. Cannot account for the underground economy

Question 22. National income estimates help policymakers make informed decisions about

  1. The promotion of consumer spending
  2. The allocation of resources and budget planning
  3. The reduction of inflation rates
  4. The regulation of the stock market

Answer: 2. The allocation of resources and budget planning

Question 23. In times of economic downturn, national income estimates can be used to

  1. Encourage more foreign investments
  2. Identify the sectors that require government bailouts
  3. Increase taxes on businesses and individuals
  4. Decrease government spending on infrastructure

Answer: 2. Identify the sectors that require government bailouts

Different Concepts Of National Income

Question 1. Gross Domestic Product (GDP) measures:

  1. The total value of goods and services produced within a country’s borders, including net income from abroad.
  2. The total value of goods and services produced by a country’s
    residents, regardless of their location.
  3. The total value of goods and services produced within a country’s borders, excluding net income from abroad.
  4. The total value of goods and services consumed within a country’s borders.

Answer: 1. The total value of goods and services produced within a country’s borders, including net income from abroad.

Explanation:

GDP measures the total value of all goods and services produced within a country’s borders, including the income earned by foreign residents within the country (net income from abroad).

Question 2. Gross National Product (GNP) is defined as: 

  1. The total value of goods and services produced within a country’s borders, excluding depreciation.
  2. The total value of goods and services produced by a country’s residents, regardless of their location.
  3. The total value of goods and services produced within a country’s borders, including indirect taxes.
  4. The total value of goods and services produced by a country’s residents, excluding net income from abroad.

Answer: 2. The total value of goods and services produced by a country’s residents, regardless of their location

Explanation:

GNP measures the total value of goods and services produced by a country’s residents, regardless of. where they are located. It includes the income earned by the country’s residents both domestically and abroad.

Question 3. Net National Product (NNP) is calculated by

  1. Deducting depreciation from Gross Domestic Product (GDP).
  2. Adding depreciation to Gross National Product (GNP).
  3. Deducting indirect taxes from Gross Domestic Product (GDP).
  4. Adding indirect taxes to Gross National Product (GNP).

Answer: 1. Deducting depreciation from Gross Domestic Product (GDP).

Explanation:

NNP is derived by subtracting depreciation (capital consumption) from Gross Domestic Product (GDP). Depreciation accounts for the wear and tear or obsolescence of physical assets used in production.

Question 4. National Disposable Income(NDI) is defined as

  1. The total income earned by a country’s residents, including net income from abroad.
  2. The total income earned by a country’s residents, excluding net income from abroad and indirect taxes.
  3. The total income earned by a country’s residents, including indirect
    taxes.
  4. The total income earned by a country’s residents,. excluding depreciation.

Answer: 2. The total income earned by a country’s residents, excluding net income from abroad and indirect taxes.

Explanation:

National Disposable Income (NDI) represents the total income earned by a country’s residents after deducting net income from abroad and indirect taxes including government transfer payments.

Question 5. Personal Income (PI) is calculated as

  1. National Disposable Income (NDI) minus corporate profits and social insurance contributions.
  2. National Income (Nl) minus indirect taxes.
  3. Gross Domestic Product (GDP) minus depreciation.
  4. Gross National Product (GNP) minus net income from abroad.

Answer: 1. National Disposable Income (NDI) minus corporate profits and social insurance contributions.

Explanation:

Personal Income (PI) is derived from National Disposable Income (NDI) by subtracting retained corporate profits and social insurance contributions and adding government transfer payments to individuals.

Question 6. Gross Domestic Product (GDP) is defined as the total

  1. Income earned by a country’s residents, regardless of their location
  2. Value of goods and services produced within a country’s borders
  3. Income earned by foreign residents within the country
  4. Value of goods and services produced by a country’s residents abroad

Answer: 2. Value of goods and services produced within a country’s borders

Explanation:

GDP measures the total value of all goods and services produced within a country’s borders during a specific period. It includes the value of goods and services produced by both domestic and foreign factors of production operating within the country.

Question 7. Gross National Product (GNP) is calculated as the total

  1. Value of goods and services produced within a country’s borders
  2. Income earned by a country’s residents, regardless of their location *
  3. Income earned by foreign residents within the country
  4. Value of goods and services produced by a country’s residents abroad

Answer: 4. Value of goods and services produced by a country’s residents abroad

Explanation:

GNP measures the total value of goods and services produced by a country’s residents, whether within the country’s borders or abroad. It includes the income earned by a country’s residents from their productive activities both domestically and overseas.

Question 8. Met National Product (NNP) is derived by deducting=

  1. Depreciation from GDP
  2. Depreciation from GNP
  3. Net indirect taxes from GDP
  4. Net indirect taxes from GNP

Answer: Depreciation from GNP

Explanation:

Net National Product (NNP) is obtained by subtracting depreciation (capital consumption) from Gross National Product (GNP). Depreciation accounts for the wear and tear or obsolescence of capital goods used in the production process. –

Question 9. National Disposable Income (NDI) is calculated by

  1. Adding depreciation to NNP
  2. Adding net indirect taxes to NNP
  3. Deducting direct taxes from NNP
  4. Deducting net indirect taxes from NNP

Answer: 3. Deducting direct taxes from NNP

Explanation:

National Disposable Income (NDI) is obtained by deducting direct taxes from Net National Product (NNP). It represents the income available to the residents of a country for consumption and saving after accounting for capital depreciation and direct taxes.

Question 10. Personal Income (PI) is derived from National Income (Nl) by

  1. Adding transfer payments and deducting undistributed corporate profits.
  2. Adding corporate profits and deducting net interest and rent
  3. Deducting direct taxes and adding transfer payments
  4. Deducting retained earnings and adding social security contributions

Answer: 1. Adding transfer payments and deducting undistributed corporate profits

Explanation:

Personal Income (PI) is obtained from National Income (Nl) by adding transfer payments (For example: Social Security benefits) received by individuals and deducting undistributed corporate profits (profits not distributed as dividends to shareholders).

Question 11. Which concept of National Income includes only the market value of final goods and services produced within a country’s borders during a specific period?

  1. Gross National Product (GNP)
  2. Net Domestic Product (NDP)
  3. Gross Domestic Product (GDP) at market price
  4. Net National Product (NNP)

Answer: 3. Gross Domestic Product (GDP) at market price

Explanation:

Gross Domestic Product (GDP) at market price is a concept of National Income that measures the total market value of all final goods and services produced within a country’s borders during a particular period. It includes goods and services produced by both domestic and foreign entities.

Question 12.  Which concept of National Income deducts depreciation (capital consumption) from Gross Domestic Product (GDP)? 

  1. Net Domestic Product (NDP)
  2. Net National Product (NNP)
  3. Gross National Product (GNP)
  4. Gross Domestic Product (GDP) at factor cost

Answer: 1. Net Domestic Product (NDP)

Explanation:

Net Domestic Product (NDP) is a concept of National Income that is obtained by deducting depreciation (capital consumption) from Gross Domestic Product (GDP). It provides a measure of the net value of domestic output after accounting for the wear and tear or obsolescence of physical assets used in the production process.

Question 13. Which concept of National Income takes into account the net income earned from foreign investments and deducts net income earned by foreigners within the country?

  1. Gross Domestic Product (GDP) at factor cost
  2. Net Domestic Product (NDP)
  3. Gross National Product (GNP)
  4. Net National Product (NNP)

Answer: 3. Gross National Product (GNP)

Explanation:

Gross National Product (GNP) is a concept of National Income that includes the total market value of all final goods and services produced by the country’s residents (both domestically and abroad) during a specific period.

It takes into account the net income earned from foreign investments (factor income from abroad) and deducts net income earned by foreigners within the country (factor income to foreigners) to arrive at GNP.

Question 14. Which concept of National income includes only the value added at each stage of production and avoids double-counting?

  1. Gross Domestic Product (GDP) at market price
  2. Net Domestic Product (NDP)
  3. Gross Domestic Product (GDP) at factor cost
  4. Gross Value Added (GVA)

Answer: 4. Gross Value Added (GVA)

Explanation:

Gross Value Added (GVA) is a concept of National Income that includes only the value added at each stage of production. It is the difference between the value of output produced and the value of intermediate consumption. GVA avoids double-counting, which may occur when calculating GDP, as it considers only the value added by each industry or sector.

Question 15. Which concept of National Income measures the total market value of all final goods and services produced within a country’s borders, excluding the value of indirect taxes and subsidies?

  1. Net Domestic Product (NDP) at factor cost
  2. Gross Domestic Product (GDP) at factor cost
  3. Gross Domestic Product (GDP) at market price
  4. Net National Product (NNP)

Answer: 2. Gross Domestic Product (GDP) at factor cost

Explanation:

Gross Domestic Product (GDP) at factor cost is a concept of National Income that measures the total market value of all final goods and services produced within a country’s borders, excluding the value of indirect taxes but including subsidies. It provides a measure of the income earned by the factors of production (labor and capital) without the distortion of indirect taxes and subsidies.

Question 16. Gross Domestic Product (GDP) is the total value of

  1. All goods and services produced within a country’s borders in a specific time period
  2. All goods and services produced by a country’s citizens, regardless of their location
  3. All goods and services produced by a country’s companies, regardless of their  ownership
  4. All final goods and services produced within a country’s borders in a specific  time period

Answer: 1. All goods and services produced within a country’s borders in a specific period

Question 17. Gross National Product (GNP) differs from GDP in that GNP

  1. Includes only the value of final goods and services
  2. Excludes the value of exports
  3. Accounts for depreciation of capital goods
  4. Includes the value of goods and services produced by a country’s citizens abroad

Answer: 4. Includes the value of goods and services produced by a country’s citizens abroad

Question 18. Net National Product (NNP) is calculated by

  1. Adding depreciation to GDP
  2. Subtracting depreciation from GDP
  3. Adding depreciation to GNP
  4. Subtracting depreciation from GNP

Answer: 2. Subtracting depreciation from GDP

Question 19. National Income (Nl) is calculated by

  1. Adding indirect taxes to NNP
  2. Subtracting indirect taxes from NNP
  3. Adding net foreign factor income to NNP
  4. Subtracting net foreign factor income from NNP

Answer: 2. Subtracting indirect taxes from NNP

Question 20. Personal Income (PI) is the total income received by

  1. Individuals before paying personal taxes
  2. Individuals after paying personal taxes
  3. Households before paying personal taxes
  4. Households after paying personal taxes

Answer: 2. Individuals after paying personal taxes

Question 21. Disposable Income (Dl) is calculated by

  1. Adding personal taxes to personal income
  2. Subtracting personal taxes from personal income
  3. Adding corporate taxes to personal income
  4. Subtracting corporate taxes from personal income

Answer: 2. Subtracting personal taxes from personal income

Question 22. Which of the following represents the broadest measure of a country’s national income? ‘

  1. GDP
  2. GNP
  3. NNP
  4. Pl

Answer: 2. GNP

Question 23. Gross National Income (GNI) is defined as: 

  1. The total value of all goods and services produced by a country’s companies,  regardless of their ownership
  2. The total value of all goods and services produced by a country’s citizens,  regardless of their location
  3. The total value of all final goods and services produced within a . country’s  borders in a specific period
  4. The total value of all goods and services produced within a country’s borders,  excluding foreign factors of production

Answer: 2. The total value of all goods and services produced by a country’s citizens,  regardless of their location

Gross Domestic Product

Question 1. The following table shows the production and prices of two goods, X and Y, in a hypothetical economy for the year 2023

National Income Accounting Hypothetical Economy

Calculate the nominal GDP of the economy for the year 2023.

  1. ₹ 2,500
  2. ₹ 3,000
  3. ₹ 3,500
  4. ₹ 4,000

Answer: 3. ₹ 3,500

Solution:

To calculate the nominal GDP, we use the formula:

Nominal GDP = I(Quantity Produced × Price per Unit) for all goods.

Nominal GDP = (100 units × ₹ 10) + (150 units × ₹  15) = ₹ 1,000 + ₹ 2,250 = ₹ 3,250.

The nominal GDP of the economy for the year 2023 is ₹ 3,250.

∴ ₹ 3500

Note: There seems to be a typo in the table provided, as the correct calculation should yield ₹ 3,250, not ₹ 3,500. Please double-check the numbers in the table to ensure accuracy.

Question 2. In a country, the nominal GDP for the year 2022 is ₹ 800 billion, and the GDP deflator for 2022 is 120.0. What is the real GDP for 2022?

  1. ₹ 480 billion
  2. ₹ 666.67 billion
  3. ₹ 666.00 billion
  4. ₹ 960 billion

Answer: 3. ₹ 666.00 billion

Solution:

Real GDP can be calculated using the formula:

Real GDP = (Nominal GDP) / (GDP deflator) x 100 Given,

Nominal GDP for 2022 = ₹ 800 billion

GDP deflator for 2022 = 120.0

Real GDP = (800 billion) / (120.0) × 100 5

Real GDP = 666.6667 billion ₹ 666.00 billion (rounded to two decimal places)

So, the real GDP for the year 2022 is approximately ₹ 666.00 billion.

Question 3. The nominal GDP of a country in the base year was ₹ 500 billion, and the real GDP in the same year was  ₹450 billion. Calculate the GDP deflator for the base year.

  1. 90.0
  2. 100.0
  3. 110.0
  4. 125.0

Answer: 2. 100.0

Solution:

The GDP deflator for the base year is calculated as

(Nominal GDP / Real GDP) × 100.

GDP deflator = (500 billion / 450 billion) × 100

GDP deflator =1.1111 × 100 = 100.0

Question 4. In the current year, the nominal GDP of the country is ₹ 600 billion, and the real GDP is ₹ 540 billion. Calculate the GDP deflator for the current year using the base year’s GDP deflator (which is 100.0).

  1. 90.0
  2. 100.0
  3. 110.0
  4. 125.0

Answer: 3. 110.0

Solution:

The GDP deflator for the current year is calculated as (Nominal GDP / Real GDP) × 100.

GDP deflator = (600 billion / 540 billion) × 100

GDP deflator = 1.1111 × 100 = 110.0

Question 5. If the GDP deflator for a particular year is 120.0 what does it indicate about the price level compared to the base year?

  1. Prices have increased by 20% compared to the base year.
  2. Prices have decreased by 20% compared to the base year.
  3. Prices have remained the same as the base year.
  4. Prices have doubled compared to the base year.

Answer: 1. Prices have increased by 20% compared to the base year.

Solution:

A GDP deflator of 120.0 means that the overall price level has increased by 20% compared to the base year (which has a GDP deflator of 100.0).

Question 6. If the GDP deflator for a particular year is 90.0, what does it indicate about the price level compared to the base year?

  1. Prices have increased by 10% compared to the base year.
  2. Prices have decreased by 10% compared to the base year.
  3. Prices have remained the same as the base year.
  4. Prices have decreased by 90% compared to the base year.

Answer: 2. Prices have decreased by 10% compared to the base year.

Solution:

A GDP deflator of 90.0 means that the overall price level has decreased by 10% compared to the base year (which has a GDP deflator of 100.0).

Gross National Product (GNP)

Question 1. In a country, the Gross National Product (GNP) for the year 2021 is calculated as follows:

  1. Gross Domestic Product (GDP) = ₹ 900 billion.
  2. Net factor income from abroad (NFIA) = ₹ 50 billion (negative value indicates net outflow of income to foreign countries)

Calculate the GNP for the year 2021.

  1. ₹ 850 billion
  2. ₹ 950 billion
  3. ₹ 950 billion (adjusted for net factor income from abroad)
  4. ₹ 850 billion (adjusted for net factor income from abroad)

Answer: 3. ₹ 950 billion (adjusted for net factor income from abroad)

Solution:

GNP is calculated by adding Net factor income from abroad (NFIA) to GDP.

GNP = GDP + NFIA

GNP = ₹ 900 billion + (- ₹ 50 billion)

GNP = ₹ 950 billion

So, the GNP for the year 2021 is  ₹ 950 billion (adjusted for net factor income from abroad).

Question 2. In a country, the Gross National Product (GNP) for the year 2022 is ₹ 1,200 billion, and Net factor income from abroad (NFIA) is  ₹ 40 billion (positive value indicates net inflow of income from foreign countries). Calculate the Gross Domestic Product (GDP) for the year 2022.

  1. ₹ 1,1 60 billion
  2. ₹ 1,240 billion
  3. ₹  1,160 million (adjusted to not factor Incomo from abroad)
  4.  ₹ 1,240 billion (adjusted for not factoring Incomo from abroad)

Answer: 3. 1,160 million (adjusted tor does not factor Incomo from abroad)

Solution:

GDP is calculated by subtracting Not factor income from abroad (NFIA) from GNP.

GDP = GNP – NFIA

GDP = ₹ 1,200 billion – ₹40 billion

GDP = ₹ 1,160 billion

So, the Gross Domestic Product (GDP) for the year 2022 is ₹ 1,160 billion (adjusted for net factor income from abroad).

Question 3. In a country, the Gross National Product (GNP) for the year 2023 is ₹ 2,500 billion, and Net factor income from abroad (NFIA) is ₹ 80 billion (positive value indicates net inflow of income from foreign countries). The GDP for the year 2023 is:

  1. ₹ 2,580 billion
  2. ₹ 2,420 billion
  3. ₹ 2,420 billion (adjusted for net factor income from abroad)
  4. ₹ 2,580 billion (adjusted for net factor income from abroad)

Answer: 3. ₹ 2,420 billion (adjusted for net factor income from abroad)

Solution:

GDP is calculated by subtracting Net factor income from abroad (NFIA) from GNP.

GDP = GNP-NFIA

GDP = ₹ 2,500 billion – ₹ 80 billion

GDP = ₹ 2,420 billion,

So, the Gross Domestic Product (GDP) for the year 2023 is ₹ 2,420 billion (adjusted for net factor income from abroad).

Question 4. In a country, the Gross National Product (GNP) for the year 2022 is calculated as follows:  Gross Domestic Product (GDP) = ₹ 900 billion Net factor income from abroad = ₹ 50 billion, What is the Gross National Product (GNP) for the year 2022?

  1. ₹ 850 billion
  2. ₹ 860 billion
  3. ₹ 950 billion
  4. ₹ 960 billion

Answer: 3. 950 billion

Solution:

Gross National Product (GNP) is calculated as the Gross Domestic Product (GDP) plus net factor income from abroad.

Given, Gross Domestic Product (GDP) = ₹ 900 billion

Net factor income from abroad = ₹ 50 billion

GNP = GDP + Net factor income from abroad

GNP = ₹ 900 billion + ₹ 50 billion

GNP = ₹ 950 billion

So, the Gross National Product (GNP) for the year 2022 is  ₹ 950 billion.

Net National Product At Market Prices (NNPMP)

Question 1. In a country, the Gross National Product (GNP) at Market Prices for the year 2021 is ₹,800 billion. During the same year, depreciation (Capital Consumption Allowance) amounts to ₹100 billion. Calculate the Net National Product at Market Prices (NNPMP) for the year 2021.

  1. ₹ 900 billion
  2. ₹ 700 billion
  3. ₹ 800 billion
  4. ₹ 600 billion

Answer: 2. ₹  700 billion

Solution:

NNPMP is calculated by subtracting depreciation (Capital Consumption Allowance) from GNP at Market Prices.

NNPMP = GNP at Market Prices – Depreciation

NNPMP = ₹ 800 billion – ₹ 100 billion

NNPMP =₹  700 billion

So, the Net National Product at Market Prices

(NNPMP) for the year 2021 is ₹ 700 billion.

Question 2. In a country, the Gross National Product (GNP) at Market Prices for the year 2022 is ₹ 1,500 billion. During the same year, depreciation (Capital Consumption Allowance) amounts to ₹ 200 billion. Calculate the Net National Product at Market Prices (NNPMP) for the year 2022.

  1. ₹ 1,300 billion ‘
  2. ₹ 1,700 billion
  3. ₹  1,300 billion (adjusted for depreciation)
  4. ₹ 1,700 billion (adjusted for depreciation).

Answer: 1. ₹ 1,300 billion (adjusted for depreciation)

Solution:

NNPMP is calculated by subtracting depreciation (Capital Consumption Allowance) from GNP at Market Prices.

NNPMP = GNP at Market Prices – Depreciation

NNPMP =  ₹ 1,500 billion – ₹  200 billion

NNPMP = ₹  1,300 billion

So, the Net National Product at Market Prices

(NNPMP) for the year 2022 is ₹ 1,300 billion (adjusted for depreciation).

Question 3. In a country, the Gross National Product (GNP) at Market Prices for the year 2023 is ₹ 2,000 billion. During the same year, depreciation (Capital Consumption Allowance) amounts to  250 billion. The Net National Product at Market Prices (NNPMP) for the year 2023 is:

  1. ₹ 2,250 billion
  2. ₹ 1,750 billion
  3. ₹  2,250 billion (adjusted for depreciation) .
  4. ₹ 1,750 billion (adjusted for depreciation)

Answer: 4. ₹ 1,750 billion (adjusted for depreciation)

Solution:

NNPMP is calculated by subtracting depreciation (Capital Consumption Allowance) from GNP at Market Prices.

NNPMP = GNP at Market Prices – Depreciation

NNPMP = ₹  2,000 billion – ₹  250 billion

NNPMP = ₹ 1,750 billion

So, the Net National Product at Market Prices

(NNPMP) for the year 2023 is ₹ 1,750 billion (adjusted for depreciation).

 Gross Domestic Product at Factor Cost (GDPFC)

Question 1. In a country, the Gross Domestic Product at Market Prices (GDPMP) for the year.2021 is ₹ 900 billion, and indirect taxes (subsidies) on products are ₹ 50 billion. Calculate the Gross Domestic Product at Factor Cost (GDPFC) for the. year 2021.

  1. ₹  850 billion
  2. ₹  950 billion
  3. ₹  950 billion (adjusted for indirect taxes)
  4. ₹  850 billion (adjusted for subsidies)

Answer: 3. ₹ 950 billion (adjusted for indirect taxes)

Solution:

GDPFC is calculated by subtracting indirect taxes (subsidies) on products from GDPMP.

GDPFC = GDPMP – Indirect taxes (subsidies) on products

GDPFC = ₹ 900 billion – ₹ 50 billion

GDPFC =  ₹  950 billion

So, the Gross Domestic Product at Factor Cost

(GDPFC) for the year 2021 is ₹ 950 billion (adjusted for indirect taxes).

Question 2. In a country, the Gross Domestic Product at Market Prices (GDPMP) for the year 2022 is ₹ 1,200 billion, and indirect taxes (subsidies) on products are ₹ 100 billion. Calculate the Gross Domestic Product at Factor Cost (GDPFC) for the year 2022.

  1. ₹ 1,100 billion
  2. ₹ 1,300 billion
  3. ₹ 1,100 billion (adjusted for indirect taxes)
  4. ₹ 1,300 billion (adjusted for subsidies)

Answer: 3. ₹ 1,100 billion (adjusted for indirect taxes)

Solution:

GDPFC is calculated by subtracting indirect taxes (subsidies) on products from GDPMP.

GDPFC = GDPMP – Indirect taxes (subsidies) on products

GDPFC = ₹ 1,200 billion – ₹ 100 billion

GDPFC = ₹ 1,100 billion ‘

So, the Gross Domestic Product at Factor Cost

(GDPFC) for the year 2022 is ₹ 1,100 billion (adjusted for indirect taxes).

Question 3. In a country, the Gross Domestic Product at Market Prices (GDPMP) for the year 2023 is ₹ 2,500 billion, and indirect taxes (subsidies) on products are Rs.200 billion. Calculate the Gross Domestic Product at Factor Cost (GDPFC) for the year 2023.

  1. ₹ 2,300 billion
  2. ₹ 2,700 billion
  3. ₹ 2,300 billion (adjusted for indirect taxes)
  4. ₹ 2,700 billion (adjusted for subsidies)

Answer: 3. ₹ 2,300 billion (adjusted for indirect taxes)

Solution:

GDPFC is calculated by subtracting indirect taxes (subsidies) on products from GDPMP.

GDPFC = GDPMP – Indirect taxes (subsidies) on products GDPFC = ₹ 2,500 billion – ₹ 200 billion

GDPFC = ₹ 2,300 billion

So, the Gross Domestic Product at Factor Cost

(GDPFC) for the year 2023 is ₹ 2,300 billion (adjusted for indirect taxes).

Net Domestic Product At Factor Cost (NDPFC)

Question 1. In a country, the Gross Domestic Product at Factor Cost (GDPFC) for the year 2021 is ₹ 800 billion, and depreciation (consumption of fixed capital) is ₹ 100 billion. Calculate the Net Domestic Product at Factor Cost (NDPFC) for the year 2021.

  1. ₹ 700 billion
  2. ₹ 900 billion
  3. ₹ 700 billion (adjusted for depreciation)
  4. ₹ 900 billion (adjusted for depreciation)

Answer: 3. ₹ 700 billion (adjusted for depreciation)

Solution:

NDPFC is calculated by subtracting depreciation from GDPFC.

NDPFC = GDPFC – Depreciation

NDPFC = ₹ 800 billion – ₹ 100 billion

NDPFC = ₹ 700 billion

So, the Net Domestic Product at Factor Cost

(NDPFC) for the year 2021 is ₹ 700 billion (adjusted for depreciation).

Question 2. In a country, the Gross Domestic Product at Factor Cost (GDPFC) for the year 2022 is ₹ 1,200 billion, and depreciation (consumption of fixed ( capital) is ₹150 billion. Calculate the Net Domestic Product at Factor Cost (NDPFC) for the year 2022.

  1. ₹ 1,050 billion.
  2. ₹ 1,350 billion.
  3. ₹ 1,050 billion (adjusted for depreciation)
  4. ₹ 1,350 billion (adjusted for depreciation)

Answer: 3. ₹ 1,050 billion (adjusted for depreciation)

Solution:

NDPFC is calculated by subtracting depreciation from GDPFC.

NDPFC = GDPFC – Depreciation

NDPFC = ₹ 1,200 billion – ₹ 150 billion

NDPFC = ₹ 1,050 billion

So, the Net Domestic Product at Factor Cost

(NDPFC) for the year 2022 is ₹ 1,050 billion (adjusted for depreciation).

Question 3. In a country, the Gross Domestic Product at Factor Cost (GDPFC) for the year 2023 is ₹ 2,500 billion, and depreciation (consumption of fixed capital) is ₹ 200 billion. Calculate the Net Domestic Product at Factor Cost (NDPFC) for the year 2023. 

  1. ₹ 2,300 billion
  2. ₹ 2,700 billion
  3. ₹ 2,300 billion (adjusted for depreciation)
  4. ₹ 2,700 billion (adjusted for depreciation)

Answer: 3. ₹ 2,300 billion (adjusted for depreciation

Solution:

NDPFC is calculated by subtracting depreciation from GDPFC.

NDPFC = GDPFC – Depreciation

NDPFC = ₹ 2,500 billion – ₹  200 billion

NDPFC = ₹  2,300 billion

So, the Net Domestic Product at Factor Cost

(NDPFC) for the year 2023 is ₹ 2,300 billion (adjusted for depreciation).

Net National Product At Factor Cost (NNPFC) Or National Income

Question 1. In a country, the Gross National Product at Factor Cost (GNPFC) for the year 2021 is ₹ 900 billion, and net indirect taxes (subsidies) on products are ₹ 50 billion. Calculate the Net National Product at Factor Cost (NNPFC) or National Income for the year 2021.

  1. ₹ 850 billion
  2. ₹ 950 billion
  3. ₹  950 billion, (adjusted for net indirect taxes)
  4. ₹ 850 billion (adjusted for subsidies)

Answer: 3. ₹ 950 billion (adjusted for net indirect taxes)

Solution:

NNPFC or National Income is calculated by subtracting net indirect taxes (subsidies) on products from GNPFC.

NNPFC = GNPFC – Net indirect taxes (subsidies) on products

NNPFC = ₹ 900 billion – ₹ 50 billion

NNPFC = ₹ 950 billion ‘

So, the Net National Product at Factor Cost

(NNPFC) or National Income for the year 2021 is ₹ 950 billion (adjusted for net indirect taxes).

Question 2. In a country, the Gross National Product at Factor Cost (GNPFC) for the year 2022 is ₹ 1,200 billion, and net indirect taxes (subsidies) on products are ₹ 100 billion. Calculate the Net National Product at Factor Cost (NNPFC) or National Income for the year 2022.

  1. ₹ 1,100 billion
  2. ₹ 1,300 billion
  3. ₹ 1,100 billion (adjusted for net indirect taxes)
  4. ₹ 1,300 billion (adjusted for subsidies)

Answer: 3. ₹  1,100 billion (adjusted for net indirect taxes)

Solution:

NNPFC or National Income is calculated by subtracting net indirect taxes (subsidies) on products from GNPFC.

NNPFC = GNPFC – Net indirect taxes (subsidies) on products

NNPFC = ₹ 1,200 billion – ₹  100 billion

NNPFC = ₹ 1,100 billion

So, the Net National Product at Factor Cost

(NNPFC) or National Income forthe year 2022 is ₹ 1,100 billion (adjusted for net indirect taxes).

Question 3. In a country, the Gross National Product at Factor Cost (GNPFC) forthe year 2023 is ₹ 2,500 billion, and net indirect taxes (subsidies) on products are ₹ 200 billion. Calculate the Net National Product at Factor Cost (NNPFC) or National Income for the year 2023.

  1. ₹ 2,300 billion
  2. ₹  2,700 billion
  3. ₹  2,300 billion (adjusted for net indirect taxes)
  4. ₹  2,700 billion (adjusted for subsidies)

Answer: 3.  ₹ 2,300 billion (adjusted for net indirect taxes)

Solution:

NNPFC or National Income is calculated by subtracting net indirect taxes (subsidies) on products from GNPFC.

NNPFC = GNPFC – Net indirect taxes (subsidies) on products

NNPFC = ₹ 2,500 billion – ₹  200 billion

NNPFC = ₹  2,300 billion

So, the Net National Product at Factor Cost

(NNPFC) or National Income for the year 2023 is ₹ 2,300 billion (adjusted for net indirect taxes).

Per Capita Income

Question 1. In a country, the Gross National Product at Factor Cost (GNPFC) for the year 2021 is ₹ 800 billion, and the total population is 200 million. Calculate the Per Capita Income for the year 2021.

  1. ₹ 4,000
  2. ₹ 4,500
  3. ₹  3,500
  4. ₹ 4,200.

Answer: ₹ 4,000

Solution:

Per Capita Income is calculated by dividing the GNPFC by the total population.

Per Capita Income = GNPFC / total population

Per Capita Income = ₹ 800 billion / 200 million

Per Capita Income = ₹ 4,000

So, the Per Capita Income for the year 2021 is ₹ 4,000.

Question 2. In a country, the Gross National Product at Factor Cost (GNPFC) for the year 2022 is ₹ 1,200 billion, and the total population is 250 million. Calculate the Per Capita Income for the year 2022. 

  1. ₹  4,800
  2. ₹  4,000
  3. ₹  4,500
  4. ₹  5,000

Answer: 3. ₹ 4,500

Solution:

Per Capita Income is calculated by dividing the

GNPFC by the total population.

Per Capita Income = GNPFC / Total population

Per Capita Income = ₹ 1,200 billion / 250 million

Per Capita Income = ₹ 4,500

So, the Per Capita Income for the year 2022 is ₹ 4,500.

Question 3. In a country, the Gross National Product at Factor Cost (GNPFC) for the year 2023 is ₹ 2,500 billion, and the total population is ₹ 300 million. Calculate the Per Capita Income for the year 2023

  1. ₹  8,000
  2. ₹  6,000
  3. ₹ 7,500
  4. ₹  5,000

Answer:  2. ₹ 6,000

Solution:

Per Capita Income is calculated by dividing the GNPFC by the total population.

Per Capita Income = GNPFC / Total population

Per Capita Income = ₹  2,500 billion / ₹ 300 million.

Per Capita Income = ₹  6,000

So, the Per Capita Income for the year 2023 is ₹ 6,000.

Personal Income

Question 1. In a country, the Gross National Product at Factor Cost (GNPFC) for the year 2021 is ₹ 900 billion, depreciation (consumption of fixed capital) is ₹ 100 billion, net indirect taxes (subsidies) on products are ₹  50 billion, and net current transfers from abroad are ₹  20 billion. Calculate the Personal Income for the year 2021.

  1. ₹  730 billion
  2. ₹  830 billion
  3. ₹  850 billion
  4. ₹ 900 billion

Answer: 2. ₹  830 billion

Solution: 

Personal Income is calculated as follows:

Personal Income = GNPFC – Depreciation + Net current transfers from abroad – Net indirect taxes (subsidies) on products

Personal Income = ₹  900 billion – 100 billion + ₹ 20 billion – ₹ 50 billion

Personal Income =  ₹  770 billion + ₹  20 billion -₹  50 billion

Personal Income = ₹  790 billion – ₹ 50 billion

Personal Income = ₹  830 billion

So, the Personal Income for the year 2021 is ₹ 830 billion.

Question 2. In a country, the Gross National Product at Factor Cost (GNPFC) for the year 2022 is ₹ 1,200 billion, depreciation (consumption of fixed capital) is ₹ 150 billion, net indirect taxes (subsidies) on products are ₹ 80 billion, and net current transfers from abroad are ₹ 30 billion. Calculate the Personal Income for the year 2022.

  1. ₹ 1,000 billion
  2. ₹ 1,100 billion
  3. ₹ 1,020 billion
  4. ₹ 1,130 billion

Answer: 3. ₹  1,020 billion

Solution:

Personal Income is calculated as follows: 

Personal Income = GNPFC – Depreciation + Net current transfers from abroad – Net indirect taxes (subsidies) on products

Personal Income = ₹  1,200 billion – ₹  150 billion + ₹ 30 billion – ₹  80 billion

Personal Income = ₹  1,050 billion +  ₹  30 billion – ₹  80 billion

Personal Income = ₹ 1,080 billion – ₹  80 billion

Personal Income =  ₹ 1,020 billion.

So, the Personal Income for the year 2022 is ₹ 1,020 billion.

Question 3. In a country, the Gross National Product at factor Cost (GNPfC) for the year 2023 is ₹ 2,500 billion, desperation (Consumption of fixed capital) is ₹ 200 billion, and net current transfers from abroad are ₹ 40 billion. Calculate the Personal income for the year 2023.

  1. ₹ 2,240 billion
  2. ₹ 2,440 billion
  3. ₹ 2,380 billion
  4. ₹ 2, 540 billion

Answer: 1. ₹ 2,240 billion

Solution:

Personal Income is calculated as follows:

Personal Income = GNPFC – Depreciation + Net current transfers from

abroad – Net indirect taxes (subsidies) on products

Personal Income = ₹ 1,200 billion – ₹  150 billion + ₹ 30 billion –  ₹ 80 billion

Personal Income = ₹ 1,050 billion + ₹ 30 billion – ₹ 80 billion

Personal Income = ₹ 1,080 billion – ₹ 80 billion

Personal Income = ₹ 1,020 billion.

So, the Personal Income for the year 2022 is ₹ 1,020 billion.

Question 4. In a country, the Gross National Product at Factor Cost (GNPFC) for the year 2023 is ₹ 2,500 billion, depreciation (consumption of fixed capital) is ₹ 200 billion, net indirect taxes (subsidies) on products are ₹ 100 billion, and net current transfers from abroad are ₹ 40 billion. Calculate the Personal Income for the year 2023.

  1. ₹  2,240 billion
  2. ₹ 2,440 billion
  3. ₹ 2,380 billion
  4. ₹  2,540 billion

Answer: 1. ₹ 2,240 billion

Solution:

Personal Income is calculated as follows:

Personal Income = GNPFC – Depreciation + Net current transfers from abroad – Net indirect taxes (subsidies) on products

Personal Income = ₹  2,500 billion – ₹  200 billion + ₹  40 billion – ₹ 100 billion

Personal Income = ₹  2,300 billion + ₹  40 billion – ₹  100 billion

Personal Income = ₹  2,340 billion – ₹  100 billion

Personal Income = ₹ 2,240 billion

So, the Personal Income for the year 2023 is ₹ 2,240 billion.

Question 5. In a country, the Gross National Product at Factor Cost (GNPFC) for the year 2021 is ₹  900 billion. The indirect taxes (net of subsidies) on products are ₹ 50 billion, and the consumption of fixed capital (depreciation) is ₹ 100 billion. Calculate the Personal Income for the year 2021, given that there are no other income transfers 

  1. ₹  750 billion
  2. ₹ 800 billion
  3. ₹  850 billion
  4. ₹  900 billion

Answer: 2. ₹ 750 billion

Solution:

Personal Income is calculated by subtracting indirect taxes (net of subsidies) on products and depreciation from GNPFC.

Personal Income = GNPFC – Indirect taxes (net of subsidies) – Depreciation

Personal Income = ₹  900 billion – ₹  50 billion – ₹ 100 billion

Personal Income = ₹ 750 billion

So, the Personal Income for the year 2021 is ₹ 750 billion.

Question 6. In a country, the Gross National Product at Factor Cost (GNPFC) for the year 2022 is  1 ₹,200 billion. The indirect taxes (net of subsidies) on products are ₹ 80 billion, and the consumption of fixed capital (depreciation) is ₹150 billion. Calculate the Personal

Income for the year 2022, given that there is no other income transfer

  1.  ₹ 960 billion
  2.  ₹ 970 billion
  3.  ₹ 980 billion
  4.  ₹ 990 billion

Answer: 2. ₹ 970 billion Solution:

Personal Income is calculated by subtracting indirect taxes (net of subsidies) on products and depreciation from GNPFC.

Personal Income = GNPFC – Indirect taxes (net of subsidies) – Depreciation

Personal Income = ₹ 1,200 billion – ₹ 80 billion – ₹ 150 billion Personal Income = ₹ 970 billion.

So, the Personal Income for the year 2022 is ₹ 970 billion.

Question 7. In a country, the Gross National Product at Factor Cost (GNPFC) for the year 2023 is ₹ 2,500 billion. The indirect taxes (net of subsidies) on products are ₹ 150 billion, and the consumption of fixed capital (depreciation) is ₹ 200 billion. Calculate the Personal Income for the year 2023, given that there is no other income transfer

  1.  ₹ 2,150 billion
  2. ₹ 2,150 billion
  3.  ₹ 2,150 billion
  4.  ₹ 2,150 billion

Answer: 2. ₹ 2,150 billion

Solution:

Personal Income is calculated by subtracting indirect taxes (net of subsidies) on products and depreciation from GNPFC.

Personal Income = GNPFC – Indirect taxes (net of subsidies) – Depreciation

Personal Income = ₹ 2,500 billion – ₹ 150 billion – ₹ 200 billion

Personal Income = ₹  2,150 billion

So, the Personal Income for the year 2023 is ₹ 2,150 billion

Disposable Personal Income (Dl)

Question 1. In a country, the Personal Income (PI) for the year 2021 is ₹ 800 billion. The direct taxes are ₹ 100 billion, and the social security contributions are ₹ 50 billion. Calculate the Disposable Personal Income (Dl) for the year 2021, given that there is no other income transfer

  1.  ₹ 650 billion
  2.  ₹ 750 billion
  3.  ₹ 700 billion
  4.  ₹ 600 billion

Answer: 1. ₹ 650 billion

Solution: 

Disposable Personal Income (Dl) is calculated by subtracting direct taxes and social security contributions from Personal Income (PI).

Disposable Personal Income (Dl) = Personal Income (PI) – Direct Taxes – Social Security Contributions

Disposable Personal Income (Dl) = ₹ 800 billion – ₹ 100 billion – ₹ 50 billion

Disposable Personal Income (Dl) = ₹ 650 billion

So, the Disposable Personal Income (Dl) for the year 2021 Is ₹ 650 billion.

Question 2. In a country, the Personal Income (PI) for the year 2022 is ₹ 1,200 billion. The direct taxes are ₹ 150 billion, and the social security contributions are ₹ 100 billion. Calculate the Disposable Personal Income (Dl) for the year 2022, given that there are no other income transfers ₹

  1.  ₹ 950 billion
  2.  ₹ 1,050 billion
  3.  ₹ 1,000 billion
  4.  ₹ 900 billion

Answer: 4. ₹ 900 billion Solution:

Disposable Personal Income (Dl) is calculated by subtracting direct taxes and social security contributions from Personal Income (PI).

Disposable Personal Income (Dl) = Personal Income (PI) – Direct Taxes – Social Security Contributions

Disposable Personal Income (Dl) = ₹ 1,200 billion – ₹ 150 billion – ₹ 100 billion

Disposable Personal Income (Dl) = ₹ 900 billion

So, the Disposable Personal Income (Dl) for the year 2022 is ₹ 900 billion.

Question 3. In a country, the Personal Income (PI) for the year 2023 is X 2,500 billion. The direct taxes are X 200 billion, and the social security contributions are ^150 billion. Calculate the Disposable Personal Income (Dl) for the year 2023, given that there are no other income transfers  ₹.

  1.  ₹  2,200 billion
  2.  ₹  2,300 billion
  3.  ₹  2,350 billion
  4.  ₹  2,400 billion

Answer:  1. ₹  2,200 billion

Solution: 

Disposable Personal Income (Dl) is calculated by subtracting direct taxes and social security contributions from Personal Income (PI).

Disposable Personal Income (Dl) = Personal Income (PI) – Direct Taxes – Social Security Contributions

Disposable Personal Income (Dl) = ₹ 2,500 billion – ₹ 200 billion – ₹ 150 billion

Disposable Personal Income (Dl) =  ₹ 2,200 billion

So, the Disposable Personal Income (Dl) for the year 2023 is ₹ 2,200 billion.

Question 4. In a country, the Personal Income (PI) for the year 2021 is ₹ 900 billion. Personal taxes for the year 2021 are ₹ 150 billion. Calculate the Disposable Personal Income (Dl) for the year 2021.

  1.  ₹ 750 billion
  2.  ₹  900 billion
  3.  ₹  750 billion (adjusted for personal taxes)
  4.  ₹ 1,050 billion

Answer: 3.  ₹ 750 billion (adjusted for personal taxes)

Solution:

Disposable Personal Income (Dl) is calculated by subtracting personal taxes from Personal Income (PI).

Dl = PI – Personal taxes Dl = ₹ 900 billion – ₹ 150 billion

Dl = ₹ 750 billion

So, the Disposable Personal Income

(Dl) for the year 2021 is ₹ 750 billion (adjusted for personal taxes).

Question 5. In a country, the Personal Income (PI) for the year 2022 is ₹ 1,200 billion. Personal taxes for the year 2022 are ₹ 180 billion. Calculate the Disposable Personal Income (Dl) for the year 2022.

  1.  ₹ 1,020 billion
  2.  ₹ 1,200 billion
  3.  ₹ 1,020 billion (adjusted for personal taxes)
  4.  ₹ 1,380 billion

Answer: 3. ₹ 1,020 billion (adjusted for personal taxes)

Solution: 

Disposable Personal Income (Dl) is calculated by subtracting personal taxes from Personal Income (PI).

Dl = PI – Personal taxes

DI = ₹ 1,200 billion – ₹180 billion

Dl =  ₹ 1,020 billion

So, the Disposable Personal Income

(Dl) for the year 2022 is ₹ 1,020 billion (adjusted for personal taxes).

Question 6. In a country, the Personal Income (PI) for the year 2023 is ₹ 2,500 billion. Personal taxes for the year 2023 are ₹ 300 billion. Calculate the Disposable Personal Income (Dl) for the year 2023.

  1.  ₹ 2,200 billion
  2.  ₹ 2,800 billion
  3.  ₹  2,200 billion (adjusted for personal taxes)
  4.  ₹ 2,800 billion (adjusted for personal taxes)

Answer: 3. ₹ 2,200 billion (adjusted for personal taxes

Solution:

Disposable Personal Income (Dl) is calculated by subtracting personal taxes from Personal Income (PI).

Dl = PI – Personal taxes

Dl = ₹ 2,500 billion – ₹  300 billion

Dl = ₹  2,200 billion

So, the Disposable Personal Income

(Dl) for the year 2023 is  2,200 billion (adjusted for personal taxes).

Private Income

Question 1. In a country, the Personal Income (PI) for the year 2021 is ₹ 900 billion. Current transfers from the government and the rest of the world to individuals for the year 2021 are ₹ 50 billion. Social contributions by individuals for the year 2021 are ₹ 100 billion. Calculate the Private Income for the year 2021.

  1.  ₹ 750 billion
  2.  ₹  800 billion
  3.  ₹  850 billion
  4.  ₹  950 billion

Answer: 2. ₹ 800 billion

Solution:

Private Income is calculated by subtracting current transfers from the government and the rest of the world to individuals and social contributions by individuals from Personal Income (PI).

Private Income = PI – Current transfers – Social contributions

Private Income = ₹ 900 billion – ₹ 50 billion – ₹ 100 billion

Private Income = ₹ 800 billion

So, the Private Income for the year 2021 is ₹  800 billion.

Question 2. In a country, the Personal Income (PI) for the year 2022 is ₹ 1,200 billion. Current transfers from the government and the rest of the world to individuals for the year 2022 is ₹ 80 billion. Social contributions by individuals for the year 2022 are ₹ 150 billion. Calculate the Private Income for the year 2022.

  1.  ₹ 950 billion
  2.  ₹ 940 billion
  3.  ₹ 930 billion
  4.  ₹ 970 billion

Answer: 4. ₹  970 billion.

Solution:

Private Income is calculated by subtracting current transfers from the government and the rest of the world to individuals and social contributions by individuals from Personal Income (PI).

Private Income = PI – Current transfers – Social contributions

Private Income = ₹ 1,200 billion – ₹ 80 billion – ₹ 150 billion

Private Income = ₹ 970 billion

So, the Private Income for the year 2022 is ₹ 970 billion.

Question 3. In a country, the Personal Income (PI) for the year 2023 is ₹ 2,500 billion. Current transfers from the government and the rest of the world to individuals for the year 2023 are ₹ 200 billion. Social contributions by individuals for the year 2023 are ₹ 200 billion. Calculate the Private Income for the year 2023.

  1.  ₹ 2,100 billion
  2.  ₹ 2,700 billion
  3.  ₹ 2,500 billion
  4.  ₹ 2,900 billion

Answer: 1. ₹ 2,100 billion

Solution:

Private Income is calculated, by subtracting current transfers from the government and the rest of the world to individuals and social contributions by individuals from Personal Income (PI).

Private Income = PI – Current transfers – Social contributions

Private Income = ₹ 2,500 billion – ₹ 200 billion – ₹ 200 billion

Private Income = ₹ 2,100 billion

So, the Private Income for the year 2023 is ₹ 2,100 billion.

Question 4. In a country, the Personal Income (PI) for the year 2021 is ₹ 900 billion. Transfer payments for the year 2021 are ₹ 100 billion, and corporate taxes are ₹ 50 billion. Calculate the Private Income for the year 2021.

  1.  ₹ 750 billion
  2.  ₹ 750 billion (adjusted for transfer payments)
  3.  ₹ 850 billion
  4.  ₹ 950 billion

Answer: 2. 750 billion (adjusted for transfer payments)

Solution:

Private Income is calculated by subtracting transfer payments and corporate taxes from Personal Income (PI).

Private Income = PI – Transfer payments – Corporate taxes Private

Income = ₹ 900 billion – ₹100 billion – ₹50 billion

Private Income = ₹ 750 billion

So, the Private Income for the year 2021 is ₹ 750 billion (adjusted for transfer payments).

Question 5. In a country, the Personal Income (PI) for the year 2022 is ₹ 1,200 billion. Transfer payments for the year 2022 are ₹ 150 billion, and corporate taxes are ₹ 80 billion. Calculate the Private Income for the year 2022.

  1.  ₹ 970 billion
  2.  ₹  1,020 billion
  3.  ₹ 970 billion (adjusted for transfer payments)
  4.  ₹ 1,080 billion

Answer:   1. ₹ 970 billion

Solution:

Private Income is calculated by subtracting transfer payments and corporate taxes from Personal Income (PI).

Private Income = PI – Transfer payments – Corporate taxes

Private Income =  ₹1,200 billion – ₹ 150 billion – ₹ 80 billion

Private Income = ₹ 970 billion

So, the Private Income for the year 2022 is ₹ 970 billion.

Question 6. In a country, the Personal Income (PI) for the year 2023 is ₹ 2,500 billion. Transfer payments for the year 2023 are ₹200 billion, and corporate taxes are? 150 billion. Calculate the Private Income for the year 2023.

  1.  ₹ 2,200 billion
  2.  ₹ 2,150 billion
  3. ₹ 2,200 billion (adjusted for transfer payments)
  4.  ₹ 2,350 billion

Answer: 2. ₹ 2,150 billion

Solution:

Private Income is calculated by subtracting transfer payments and corporate taxes from Personal Income (PI).

Private Income = PI – Transfer payments – Corporate taxes Private

Income = ₹ 2,500 billion – ₹ 200 billion – ₹ 150 billion

Private Income = ₹ 2,150 billion

So, the Private Income for the year 2023 is ₹ 2,150 billion.

Measurement Of National Income In India

Question 1. Which of the following organizations is responsible for estimating the National Income of India? In India, the organization responsible for estimating national income is

  1. Reserve Bank of India (RBI)
  2. Central Statistical Office (CSO)
  3. Ministry of Finance
  4. World Bank

Answer: 2. Central Statistical Office (CSO)

Explanation:

The Central Statistical Office (CSO) is the organization responsible for estimating the National Income and related macroeconomicindicators in India. It operates under the Ministry of Statistics and Programme Implementation (MOSPI).

Question 2.  Which of the following methods is used to estimate the National Income of India?

  1. Expenditure approach
  2. Consumer Price Index method
  3. Profit and Loss method
  4. Balance of Payments Approach

Answer:  1. Expenditure approach

Explanation:

The Expenditure approach is one of the methods used to estimate the National Income of India. It calculates the total expenditure on all final goods and services produced in the country during a specific period. It includes components like consumption expenditure, investment expenditure, government expenditure, and net exports.

Question 3. Which of the following is NOT considered a part of the National Income of India?

  1. Wages of factory workers
  2. Dividends received by shareholders from a domestic company
  3. Profits earned by a foreign company from its operations in India
  4. Government grants are given to a state for infrastructure development

Answer: 3. Profits earned by a foreign company from its operations in India

Explanation:

The National Income of India includes wages, salaries, profits, rents, and dividends earned within the country’s border Profits earned by a foreign company from its operations in India would be accounted for in Gross, National Income (GNI) rather than National Income, as GNI includes both domestic and foreign factors of production.

Question 4. Which base year is currently used for calculating the real Gross Domestic Product (GDP) in India?

  1. 2010-2011
  2. 2004-2005
  3. 2015-2016
  4. 2008-2009

Answer: 1. 2010-2011

Explanation:

As of my last update in September 2021, the base year used for calculating the real Gross Domestic Product (GDP) in India was

2010-2011. The base year is periodically revised to account for changes in the structure of the economy and to provide more accurate estimates of economic growth.

Question 5. Which component of National Income in India is known as the “single largest component” contributing to the economy’s output?

  1. Agriculture
  2. Manufacturing
  3. Services
  4. Construction

Answer: 3. Services

Explanation:

In the Indian economy, the Services sector is known as the “single largest component” contributing to the country’s output. It includes various activities like trade, transport, communication, banking, education, healthcare, and other services, which have significant contributions to the overall National Income of India.

Question 6. Which organization is responsible for estimating and publishing National Income data in India?

  1. Reserve Bank of India (RBI)
  2. Ministry of Finance
  3. Central Statistical Office (CSO)
  4. Indian Statistical Institute (ISI)

Answer: 3. CentrakStatistical Office (CSO)

Explanation:

In India, the Central Statistical Office (CSO), which functions under the Ministry of Statistics and Programme Implementation (MoSPI), is responsible for estimating and publishing National Income data. The CSO prepares estimates of GDP and other macroeconomic indicators regularly.

Question 7. Which method is used to estimate National Income in India?

  1. Expenditure approach
  2. Production approach
  3. Income approach
  4. All of the above ‘

Answer: 4. All of the above

Explanation:

In India, National Income is estimated using all three approaches: expenditure approach, production approach, and income approach. These approaches provide different perspectives on measuring the total economic output of the country and help ensure accuracy and reliability in the estimation process.

Question 8. Which of the following methods is primarily used to estimate national income in India?

  1. Production approach
  2. Expenditure approach
  3. Income approach
  4. All of the above

Answer: 4. All of the above

Question 9. The base year for estimating Gross Domestic Product (GDP) using constant prices in India is typically updated every

  1. 5 years
  2. 7 years
  3. 10 years
  4. 12 years

Answer:  1. 5 years

Question 10. In India, Gross Domestic Product (GDP) at market prices is calculated by adding

  1. Indirect taxes and depreciation to GDP at factor cost
  2. Indirect taxes and net factor income from abroad to GDP at factor cost
  3. Indirect taxes and subsidies to GDP at factor cost
  4. Indirect taxes and net factor income from abroad to GDP at market prices

Answer:  4. Indirect taxes and net factor income from abroad to GDP at market prices

Question 11. National Income in India is also known as

  1. Gross National Product (GNP)
  2. Net Domestic Product (NDP)
  3. Net National Product (NNP)
  4. Gross Domestic Product (GDP)

Answer: 3. Net National Product (NNP)

Question 12. The Central Statistical Office (CSO) in India operates under the purview of the

  1. Ministry of Finance
  2. Ministry of Statistics and Programme Implementation
  3. Reserve Bank of India (RBI)
  4. Planning Commission

Answer: 2. Ministry of Statistics and Programme Implementation

Question 13. In the context of India’s national income estimation, GVA stands for

  1. Gross Value Added
  2. Gross Variable Analysis
  3. Government Value Assessment
  4. Government Variable Account

Answer: 1. Gross Value Added

Question 14. Which of the following sectors is NOT covered in the estimation of national income in India?

  1. Agriculture and Allied Activities
  2. Manufacturing
  3. Financial Services
  4. Household Consumption

Answer: 4. Household Consumption

Question 15. The base year for computing the Gross Domestic Product (GDP) in India is generally revised after every

  1. 5 years
  2. 8 years.
  3. 10 years
  4. 15 years

Answer: 3. 10 years

Explanation:

In India, the base year for computing GDP and other economic indicators is typically revised approximately every 10 years. The revision of the base year helps in incorporating changes in the structure of the economy and updating the weights of various sectors based on their contributions to GDP.

Question 16. Which factor cost adjustment is necessary to arrive at Gross Domestic Product (GDP) at factor cost from GDP at market prices in India?

  1. Deducting indirect taxes and adding subsidies
  2. Adding indirect taxes and deducting subsidies
  3. Adding net exports
  4. Deducting net exports

Answer: 1. Deducting indirect taxes and adding subsidies Explanation:

To arrive at Gross Domestic Product (GDP) at factor cost from GDP at market prices in India, the adjustment involves deducting indirect taxes (example, excise duty, sales tax) and adding subsidies provided by the government. This adjustment eliminates the impact of indirect taxes and subsidies to calculate the income earned by the factors of production.

Question 17. Which of the following sectors is NOT included in the sectoral classification used for estimating National Income in India?

  1. Agriculture and allied activities
  2. Manufacturing.
  3. Services
  4. Foreign Trade

Answer: 4. Foreign Trade

Explanation:

In the sectoral classification used for estimating National Income in India, the foreign trade sector is not considered as a separate sector. Foreign trade, including exports and imports, is taken into account when estimating the GDP through the expenditure approach (Net Exports) but is not treated as a separate sector in the production-based estimation. Instead, it is incorporated into the overall calculations using the appropriate approach.

Question 18. In India, which organization is responsible for the estimation of National Income?

  1. Ministry of Finance
  2. Reserve Bank of India (RBI)
  3. Central Statistical Office (CSO)
  4. Planning Commission of India

Answer: 3. Central Statistical Office (CSO),

Explanation:

In India, the Central Statistical Office (CSO) is responsible for the estimation of National Income and other macroeconomic indicators. It operates under the Ministry of Statistics and Programme Implementation.

Question 19. Which factor-based method is used for calculating Gross Domestic Product (GDP) in India?

  1. Production Approach
  2. Expenditure Approach
  3. Income Approach
  4. Value Added Approach

Answer: 3. Income Approach

Explanation:

In India, the Income Approach is used for calculating Gross Domestic Product (GDP). It estimates GDP by summing up all the factor incomes earned by individuals and businesses during a specific period, such as wages, interest, rent, and profits.

Question 20. Which fiscal year is considered for the computation of India’s National Income statistics?

  1. January 1st to December 31st
  2. April 1st to March 31st
  3. July 1st to June 30th
  4. October 1st to September 30th

Answer: 2. April 1st to March 31st

Explanation:

In India, the fiscal year for the computation of National Income statistics is from April 1st to March 31st. It aligns with the country’s financial year.

Question 21. In India, which sector contributes the most to the Gross Domestic Product (GDP)?

  1. Agriculture and Allied Activities
  2. Manufacturing
  3. Services
  4. Mining and Quarrying

Answer: 3. Services

Explanation:

In India, the services sector is the largest contributor to the Gross Domestic Product (GDP). It includes various industries such as banking, IT, telecommunications, healthcare, education, and more.

Question 22. In the context of National Income accounting, what does GVA stand for?

  1. Gross Value Adjustment
  2. Gross Value Added
  3. Gross Variable Assessment
  4. General Value Adjustment

Answer: 2. Gross Value Added

Explanation:

GVA stands for Gross Value Added. It is a concept used in National Income accounting that measures the value added by each industry or sector to the economy during the production process. GVA is used as a key input in calculating Gross Domestic Product (GDP) in India.

The Circular Flow Of Income

Question 1. In a simple economy, the total value of goods and services produced (Gross Domestic Product – GDP) is ₹ 500 billion. The total income earned by households (wages, rent, and profits) is ₹ 400 billion. Calculate the total value of savings and taxes in this economy.

  1. ₹ 100 billion
  2. ₹ 200 billion
  3. ₹ 300 billion
  4. ₹ 400 billion

Answer: 1. ₹ 100 billion

Solution:

In a simple economy, the total value of goods and services produced (GDP) is equal to the total income earned by households (wages, rent, and profits).

Therefore, the total value of savings and taxes is equal to the difference between GDP and total income earned by households.

Total Value of Savings and Taxes = GDP – Total Income earned by households

Total Value of Savings and Taxes =  ₹ 500 billion – ₹ 400 billion

Total Value of Savings and Taxes = ₹ 100 billion

So, the total value of savings and taxes in this economy is ₹ 100 billion.

Question 2. In a closed economy, the total value of goods and services produced (Gross Domestic Product – GDP) is ₹ 800 billion. The total value of consumption expenditure is ₹ 600 billion. Calculate the total value of savings in this closed economy.

  1.  100 billion
  2. ₹ 200 billion
  3. ₹ 300 billion
  4. ₹ 400 billion

Answer: 3. ₹ 300 billion

Solution:

In a closed economy, the total value of goods and services produced (GDP) is equal to the total value of consumption expenditure plus the total value of savings (since there are no exports or imports).

Total Value of Savings = GDP – Total Value of Consumption Expenditure

Total Value of Savings = ₹ 800 billion – ₹ 600 billion

Total Value of Savings = ₹ 200 billion

So, the total value of savings in this closed economy is ₹ 200 billion.

Question 3. In an open economy, the total value of goods and services produced (Gross Domestic Product – GDP) is ₹ 1,500 billion. The total value of consumption expenditure is ₹ 1,000 billion, and exports are ₹ 300 billion. Calculate the total value of savings in this open economy.

  1. ₹ 300 billion
  2. ₹ 500 billion
  3. ₹ 800 billion
  4. v 1,200 billion

Answer: 1. ₹ 300 billion

Solution:

In an open economy, the total value of goods and services produced (GDP) is equal to the total value of consumption expenditure plus the total value of savings plus net exports (exports – imports).

Total Value of Savings + Net Exports = GDP – Total Value of Consumption Expenditure

Total Value of Savings + ₹ 300 billion  = ₹ 1,500 billion – ₹ 1,000 billion

Total Value of Savings = ₹ 500 billion – ₹ 300 billion

Total Value of Savings = ₹ 200 billion

So, the total value of savings in this open economy is ₹ 200 billion.

Question 4. In a two-sector economy, the total value of output (Gross Domestic Product) is ₹ 800 billion. Calculate the total value of income generated in the economy.

  1. ₹ 800 billion
  2. ₹ 600 billion
  3. ₹ 400 billion
  4. ₹ 1,200 billion

Answer: 1. ₹ 800 billion

Solution:

In a two-sector economy, the total value of output (Gross Domestic Product) is equal to the total value of income generated. Therefore, the total value of income generated in the economy is ₹ 800 billion.

Question 5. In a three-sector economy, the total value of output (Gross Domestic Product) is ₹  1,200 billion. The value of exports is ₹ 100 billion, and the value of government spending on goods and services is ₹ 150 billion. Calculate the total value of income generated in (the economy).

  1. ₹ 1,200 billion
  2. ₹ 1,050 billion
  3. ₹ 950 billion
  4. ₹ 1,000 billion

Answer: 2.  1,050 billion

Solution:

In a three-sector economy, the total value of output (Gross Domestic Product) is equal to the total value of income generated plus taxes minus subsidies. Since there are no taxes or subsidies mentioned in the question, the total value of income generated in the economy is ₹ 1,200 billion.

Total value of income generated = Total value of output Total value of income generated = ₹ 1,200 billion

Question 6. In a four-sector economy, the total value of output (Gross Domestic Product) is ₹ 2,000 billion. The value of imports is ₹ 300 billion, and the value of government spending on goods and services is ₹ 400 billion. Calculate the total value of income generated in the economy.

  1. ₹ 1,300 billion
  2. ₹ 1,700 billion
  3. ₹ 2,000 billion
  4. ₹  2,700 billion

Answer: 2. ₹ 1,700 billion

Solution:

In a four-sector economy, the total value of output (Gross Domestic Product) is equal to the total value of income generated plus taxes minus subsidies and imports.

Total value of income generated = Total value of output – Imports

Total value of income generated =₹ 2,000 billion – ₹ 300 billion

The total value of income generated = ₹ 1,700 billion

Since there are no taxes or subsidies mentioned in the question, the total value of income generated in the economy is ₹ 1,700 billion.

The total value of income generated = ₹ 1,700 billion

Value Added Method or Product Method

Question 1. Consider a three-stage production process. The value of raw materials purchased by a firm is ₹ 500, the cost of intermediate goods is ₹ 300, and the firm adds a value of ₹ 200 to produce the final goods. Calculate the value added by the firm.

  1. ₹ 200
  2. ₹ 300
  3. ₹ 500
  4. ₹ 1,000

Answer: 1. ₹ 200

Solution:

The value added by a firm in the production process is the difference between the value of its output and the value of its inputs.

Value Added = Value of Output – Value of Inputs

Value Added = ₹ 200 (final goods value) – (₹ 500 + ₹ 300) (raw materials + intermediate goods).

Value Added = ₹ 200 – ₹ 800

Value Added = ₹ 200

So, the value added by the firm is ₹ 200.

Question 2. Consider a four-stage production process. The value of raw materials purchased by a firm is ₹ 800, the cost of intermediate goods at each stage is ₹ 100,₹150, and ₹ 200, respectively. The firm adds a value of ₹ 300 at the final stage to produce the final goods. Calculate the value added by the firm.

  1. ₹ 100 ‘
  2. ₹ 150
  3. ₹ 300
  4. ₹ 450

Answer: 4. ₹ 450

Solution:

The value added by a firm in the production process is the difference between the value of its output and the value of its inputs.

Value Added = Value of Output – Value of Inputs

Value Added = ₹ 300 (final goods value) – (₹ 800 + ₹ 100 + ₹ 150 + ₹ 200) (raw materials + intermediate goods at each stage)

Value Added = ₹ 300 – ₹ 1250

Value Added = ₹ 450

So, the value added by the firm is ₹ 450.

Question 3. Consider a two-stage production process. The value of raw materials purchased by a firm is ₹ 400, and the firm adds a value of ₹ 600 to produce the final goods. Calculate the value added by the firm.

  1. ₹ 400
  2. ₹ 600
  3. ₹ 1,000
  4. ₹ 200

Answer: 4. ₹ 200

Solution:

The value added by a firm in the production process is the difference between the value of its output and the value of its inputs.

Value Added = Value of Output – Value of Inputs

Value Added = ₹ 600 (final goods value) – ₹ 400 (raw materials)

Value Added = ₹ 600 – ₹ 400

Value Added = ₹ 200

So, the value added by the firm is ₹ 200.

Question 4. In a three-stage production process, the value of raw materials purchased by a company is ₹ 500 million. The company adds value worth ₹ 300 million during the production process. Calculate the total value of the final product. ‘

  1. ₹ 100 million
  2. ₹ 200 million
  3. ₹ 300 million
  4. ₹ 800 million

Answer: ₹800 million

Solution:

The Value Added Method calculates the value of the final product by summing up the value added at each stage of production.

Total value of final product = Value of raw materials + Value added Total value of final product = ₹ 500 million + ₹ 300 million ‘

The total value of the final product =  ₹ 800 million

So, the total value of the final product is ₹ 800 million.

Question 5. In a four-stage production process, the value of intermediate goods purchased by a company is ₹ 800 billion. The company adds value worth ₹ 400 billion during the production process. Calculate the total value of the final product.

  1. ₹  200 billion
  2. ₹  400 billion
  3. ₹  800 billion
  4. ₹ 1,200 billion

Answer: 4. ₹1,200 billion

Solution:

The Value Added Method calculates the value of the final product by summing up the value added at each stage of production.

Total value of final product = Value of intermediate goods + Value added

The total value of final product = ₹ 800 billion + ₹  400 billion

The total value of the final product = ₹ 1,200 billion.

So, the total value of the final product is ₹1,200 billion.

Question 6. In a five-stage production process, the value of raw materials purchased by a company is ₹ 1,000 million. The company adds value worth ₹ 500 million during the production process. Calculate the total value of the final product.

  1. ₹ 500 million
  2. ₹ 1,000 million.
  3. ₹ 1,500 million
  4. ₹ 2,000 million

Answer: 3. ₹ 1,500 million.

Solution: 

The Value Added Method calculates the value of the final product by

summing up the value added at each stage of production.

Total value of final product = Value of raw materials + Value added

Total value of final product = ₹ 1,000 million + ₹ 500 million

The total value of the final product = ₹ 1,500 million

So, the total value of the final product is ₹ 1,500 million.

Income Method

Question 1. In an economy, the following income components are given: employee compensation (₹ 300 billion), rents (₹ 50 billion), interest 100 billion), proprietor’s income (₹  150 billion), corporate profits 200 billion), and taxes on production and imports (₹ 50 billion). Calculate the Gross Domestic Product (GDP) using the Income Method.

  1. ₹ 500 billion
  2. ₹ 700 billion
  3. ₹ 800 billion
  4. ₹ 850 billion

Answer: 3. ₹ 800 billion

Solution:

The Income Method calculates the Gross Domestic Product (GDP) by summing up all the income components earned in the economy.

GDP = Employee compensation + Rents + Interest + Proprietor’s income + Corporate profits + Taxes on production and imports

GDP = ₹ 300 billion + ₹ 50 billion + ₹ 100 billion + ₹ 150 billion + ₹ 200 billion + ₹ 50 billion

GDP = ₹ 800 billion

So, the Gross Domestic Product

(GDP) using the Income Method is ₹ 800 billion.

Question 2. In an economy, the following income components are given: employee compensation (₹ 400 billion), rents (₹ 70 billion), interest (₹ 120 billion), proprietor’s income (₹ 180 billion), corporate profits (₹ 250 billion), and taxes on production and imports (₹ 60 billion). Calculate the Gross Domestic Product (GDP) using the Income Method.

  1. ₹ 800 billion
  2. ₹ 900 billion
  3. ₹ 1,000 billion
  4. ₹ 1,080 billion

Answer: 2. ₹ 900 billion

Solution:

The Income Method calculates the Gross Domestic Product (GDP) by summing up all the income components earned in the economy.

GDP = Employee compensation + Rents + Interest + Proprietor’s income + Corporate profits + Taxes on production and imports

GDP = ₹ 400 billion + ₹ 70 billion + ₹ 120 billion + ₹ 180 billion + ₹ 250 billion + ₹ 60 billion.

GDP = ₹ 900 billion

So, the Gross Domestic Product

(GDP) using the Income Method is ₹ 900 billion.

Question 3. In an economy, the following income components are given: employee compensation (₹ 500 billion), rents (₹ 90 billion), interest (? 150 billion), proprietor’s income (₹ 200 billion), corporate profits (₹ 300 billion), and taxes on production and imports (₹  80 billion). Calculate the Gross Domestic Product (GDP) using the Income Method.

  1. ₹ 950 billion
  2. ₹ 1,000 billion
  3. ₹ 1,200 billion
  4. ₹ 1,220 billion.

Answer: 4. ₹  1,220 billion

Solution:

The Income Method calculates the Gross Domestic Product (GDP) by summing up all the income components earned in the economy.

GDP = Employee compensation + Rents + Interest + Proprietor’s income + Corporate profits + Taxes on production and imports

GDP =   500 billion +₹ 90 billion + ₹ 150 billion + ₹  200 billion + ₹  300 billion +  80 billion

GDP = ₹ 1,220 billion

So, the Gross Domestic Product

(GDP) using the Income Method is ₹ 1,220 billion.

Question 4. In a country, the total compensation of employees (wages, salaries, and benefits) for the year 2021 is ₹ 500 billion. The gross operating surplus (profit) earned by businesses for the year 2021 is ₹  300 billion. Calculate the Gross National Income (GNI) for the year 2021.

  1. ₹ 200 billion
  2. ₹ 500 billion
  3. ₹ 800 billion
  4. ₹  300 billion

Answer: 3.  ₹ 800 billion

Solution:

The Income Method calculates Gross National Income (GNI) by summing up the total compensation of employees and gross operating surplus.

GNI = Total compensation of employees + Gross operating surplus

GNI = ₹ 500 billion + ₹ 300 billion

GNI = ₹ 800 billion

So, the Gross National Income

(GNI) for the year 2021 is ₹ 800 billion.

Question 5. In a country, the total compensation of employees (wages, salaries, and benefits) for the year 2022 is ₹ 600 billion. The gross operating surplus (profit) earned by businesses for the year 2022 is ₹  400 billion. Calculate the Gross National Income (GNI) for the year 2022.

  1. ₹ 1,000 billion
  2. ₹  400 billion
  3. ₹  600 billion
  4. ₹ 1,200 billion

Answer: 1. ₹ 1,000 billion

Solution:

The Income Method calculates Gross National Income (GNI) by summing up the total compensation of employees and gross operating surplus.

GNI = Total compensation of employees + Gross operating surplus

GNI = ₹ 600 billion + ₹ 400 billion

GNI = ₹ 1,000 billion

So, the Gross National Income (GNI) for the year 2022 is ₹ 1,000 billion.

Question 6. In a country, the total compensation of employees (wages, salaries, and benefits) for the year 2023 is ₹ 800 billion. The gross operating surplus (profit) earned by businesses for the year 2023 is ₹ 500 billion. Calculate the Gross National Income (GNI) for the year 2023.

  1. ₹ 1,300 billion
  2. ₹ 1,500 billion
  3. ₹ 1,300 billion
  4. ₹ 1,500 billion

Answer: 2. ₹ 1,500 billion

Solution: 

The Income Method calculates Gross National Income (GNI) by summing up the total compensation of employees and gross operating surplus.

GNI = Total compensation of employees + Gross operating surplus

GNI = ₹ 800 billion + ₹ 500 billion

GNI = ₹ 1,500 billion

So, the Gross National Income

(GNI) for the year 2023 is ₹ 1,500 billion.

Expenditure Method

Question 1. In a country, the total private consumption expenditure for the year 2021 is ₹ 800 billion. The total investment expenditure for the year 2021 is ₹ 200 billion. The government’s total expenditure on goods and services for the year 2021 is ₹ 300 billion. Calculate the Gross Domestic Product (GDP) for the year 2021.

  1. ₹ 500 billion
  2. ₹ 1,000 billion
  3. ₹ 1,300 billion
  4. ₹ 900 billion ‘

Answer: 2. ₹ 1,000 billion

Solution:

The Expenditure Method calculates Gross Domestic Product (GDP) by summing up the total private consumption expenditure, total investment expenditure, and, government
expenditure on goods and services.

GDP = Total private consumption expenditure + Total investment expenditure + Government expenditure on goods and services

GDP = ₹ 800 billion + ₹ 200 billion + ₹300 billion

GDP = ₹ 1,000 billion

So, the Gross Domestic Product

(GDP) for the year 2021 is ₹ 1,000 billion.

Question 2. In a country, the total private consumption expenditure for the year 2022 is ₹900 billion. The total investment expenditure for the year 2022 is ₹ 250 billion. The government’s total expenditure on goods and services for the year 2022 is ₹ 350 billion. Calculate the Gross Domestic Product (GDP) for the year 2022.

  1. ₹ 1,500 billion
  2. ₹  1,100 billion
  3. ₹ 1,200 billion
  4. ₹ 1,500 billion.

Answer: ₹ 3. 1,200 billion

Solution:

The Expenditure Method calculates Gross Domestic Product (GDP) by summing up the total private consumption expenditure, total investment expenditure, and government expenditure on goods and services.

GDP = Total private consumption expenditure + Total investment expenditure + Government expenditure on goods and services

GDP= ₹ 900 billion + ₹ 250 billion + ₹ 350 billion

GDP = ₹ 1,200 billion

So, the Gross Domestic Product

(GDP) for the year 2022 is ₹1,200 billion.

Question 3. In a country, the total private consumption expenditure for the year 2023 is ₹ 1,200 billion. The total investment expenditure for the year 2023 is ₹ 300 billion. The government’s total expenditure on goods and services for the year 2023 is ₹  400 billion. Calculate the Gross Domestic Product (GDP) for the year 2023.

  1. ₹ 1,500 billion
  2. ₹ 1,900 billion
  3. ₹ 1,900 billion (adjusted for imports)
  4. ₹ 1,500 billion (adjusted for exports)

Answer: 2. ₹ 1,900 billion

Solution:

The Expenditure Method calculates Gross Domestic Product (GDP) by summing up the total private consumption expenditure, total investment expenditure, and government expenditure on goods and services.

GDP = Total private consumption expenditure + Total investment expenditure + Government expenditure on goods and services

GDP = ₹ 1,200 billion + ₹ 300 billion + ₹ 400 billion

GDP = ₹ 1,900 billion

So, the Gross Domestic Product

(GDP) for the year 2023 is ₹1,900 billion.

Question 4. In a country, the total private consumption expenditure for the year 2021 is ₹ 800 billion. The gross private domestic investment for the year 2021 is ₹ 200 billion. The government expenditure on goods and services for the year 2021 is ₹ 300 billion, and the net exports (exports minus imports) for the year 2021 are -₹ 100 billion. Calculate the Gross Domestic Product. (GDP) for the year 2021.

  1. ₹ 1,000 billion
  2. ₹ 1,100 billion
  3. ₹ 1,200 billion
  4. ₹ 900 billion

Answer: 1. ₹ 1,000 billion

Solution:

The Expenditure Method calculates Gross Domestic Product (GDP) by summing up private consumption expenditure, gross private domestic investment, government expenditure on goods and services, and net exports.

GDP = Private consumption expenditure + Gross private domestic investment + Government expenditure on goods and services + Net exports

GDP = ₹ 800 billion + ₹ 200 billion + ₹ 300 billion + (- ₹ 100 billion)

GDP = ₹ 1,000 billion

So, the Gross Domestic Product

(GDP) for the year 2021 is ₹ 1,000 billion.

Question 5. In a country, the total private consumption expenditure for the year 2022 is ₹ 1,200 billion. The gross private domestic investment for the year 2022 is ₹ 300 billion. The government expenditure on goods and services for the year 2022 is ₹ 400 billion, and the net exports (exports minus imports) for the year 2022 are -₹ 150 billion. Calculate the Gross Domestic Product (GDP) for the year 2022.

  1. ₹ 1,450 billion
  2. ₹ 1,350 billion
  3. ₹ 1,550 billion
  4. ₹ 1,100 billion

Answer: 2. 1,350 billion

Solution:

The Expenditure Method calculates Gross Domestic Product (GDP) by summing up private consumption expenditure,-gross private domestic investment, government expenditure on goods and services, and net exports.

GDP = Private consumption expenditure + Gross private domestic investment + Government expenditure on goods and services + Net exports

GDP = ₹ 1,200 billion + ₹ 300 billion + ₹ 400 billion + (-₹ 150 billion)

GDP = ₹ 1,350 billion.

So, the Gross Domestic Product

(GDP) for the year 2022 is ₹ 1,350 billion.

Question 6. In a country, the total private consumption expenditure for the year 2023 is ₹ 1,500 billion. The gross private domestic investment for the year 2023 is? 400 billion. The government expenditure on goods and services for the year 2023 is ₹ 500 billion, and the net exports (exports minus imports) for the year 2023 are -₹ 200 billion. Calculate the Gross Domestic Product (GDP) for the year 2023.

  1. ₹ 1,300 billion
  2. ₹ 1,300 billion
  3. ₹ 1,600 billion ‘
  4. ₹ 1,200 billion

Answer: 3. 1,600 billion

Solution:

The Expenditure Method calculates Gross Domestic Product (GDP) by summing up private consumption expenditure, gross private domestic investment, government expenditure on goods and services, and net exports.

GDP = Private consumption expenditure + Gross private domestic investment + Government expenditure on goods and services + Net exports

GDP = ₹ 1,500 billion + 400 billion + ₹ 500 billion + (-₹ 200 billion) GDP = ₹ 1,600 billion

So, the Gross Domestic Product

(GDP) for the year 2023 is ₹ 1,600 billion.

The System of Regional Accounts In India

Question 1. The System of Regional Accounts in India provides economic data at which level of geographical aggregation?

  1. District level
  2. State level
  3. National level
  4. International level

Answer: 2. State level

Explanation:

The System of Regional Accounts in India provides economic data at the state level. It focuses on measuring and analyzing the economic performance and indicators of
individual states and union territories within the country.

Question 2. Which government agency is responsible for preparing the System of Regional Accounts in India?

  1. Ministry of Finance.
  2. Reserve Bank of India (RBI)
  3. Central Statistical Office (CSO)
  4. National Institution for Transforming India (NITI Aayog)

Answer: 3. Central Statistical Office (CSO)

Explanation:

The Central Statistical Office (CSO), operating under the Ministry of Statistics and Programme Implementation, is responsible for preparing and publishing the System of Regional Accounts in India.

Question 3. The System of Regional Accounts in India provides data on which of the following aspects at the state level?

  1. Population and demographic trends
  2. Agricultural production and land use
  3. Industrial output and manufacturing activities
  4. All of the above

Answer: 4. All of the above

Explanation:

The System of Regional Accounts in India provides data on various aspects at the state level, including population and demographic trends, agricultural production and land use, industrial output and manufacturing activities, services sector performance, and other economic indicator

Question 4. Which of the following is NOT a primary purpose of the System of Regional Accounts in India?

  1. Facilitating inter-state economic comparisons
  2. Informing state-level economic planning and policy formulation
  3. Identifying regional disparities and inequalities
  4. Regulating regional fiscal policies

Answer: 4. Regulating regional fiscal policies

Explanation:

The System of Regional Accounts in India is primarily focused on facilitating inter-state economic comparisons, informing state-level economic planning and policy formulation, and identifying regional disparities and inequalities. It does not involve regulating regional fiscal policies, which is the domain of state governments and central fiscal authorities.

Question 5. Which statistical yearbook published by the CSO includes the data and analysis on the System of Regional Accounts in India?

  1. Economic Survey of India
  2. Indian Financial Yearbook
  3. India in Figures
  4. National Accounts Statistics.

Answer: 4. National Accounts Statistics

Explanation:

The National Accounts Statistics, published by the Central Statistical Office (CSO), provides comprehensive data and analysis on the System of Regional Accounts in India, along with other macroeconomic indicators and national income accounting data.

Question 6. What is the primary purpose of the System of Regional Accounts in India?

  1. To estimate the national income of the country
  2. To measure the economic growth of different states
  3. To calculate the GDP of individual cities
  4. To track the inflation rate at the regional level

Answer: 2. To measure the economic growth of different states

Explanation:

The System of Regional Accounts in India is primarily used to measure and analyze the economic growth and performance of different states and regions within the country. It provides valuable data on the regional distribution of economic activities and helps in identifying disparities and development imbalances. . .

Question 7. Which organization is responsible for preparing the System of Regional Accounts in India? 

  1. Reserve Bank of India (RBI)
  2. Ministry of Finance
  3. Central Statistical Office (CSO)
  4. National Sample Survey Office (NSSO)

Answer: 3. Central Statistical Office (CSO)

Explanation:

The Central Statistical Office (CSO), operating under the Ministry of Statistics and Programme Implementation, is responsible for preparing the System of Regional Accounts in India.

Question 8. Which of the following indicators is NOT covered in the System of Regional Accounts in India?

  1. Gross State Domestic Product (GSDP)
  2. Per Capita Income of states
  3. Industrial Production Index of States
  4. National Unemployment Rate

Answer: 4. National Unemployment Rate

Explanation:

The System of Regional Accounts in India primarily focuses on regional economic indicators such as Gross State Domestic Product (GSDP), per capita income of states, and industrial production index of states. The national unemployment rate is a macroeconomic indicator that is not specific to individual states and is not covered under regional accounts.

Question 9. Which method is used for estimating the Gross State Domestic Product (GSDP) in India? 

  1. Production Approach
  2. Income Approach
  3. Expenditure Approach
  4. Value Added Approach

Answer: 3. Expenditure Approach

Explanation:

The Expenditure Approach is used for estimating the Gross State Domestic Product (GSDP) in India. It calculates the GSDP by summing – up all the final expenditures made on goods and services produced within the state during a specific period.

Question 10. The System of Regional Accounts in India provides data at which level of geographical aggregation?

  1. District level
  2. City Level
  3. State level
  4. Village level

Answer: 3. State level.

Explanation:

The System of Regional Accounts in India provides economic data and estimates at the state level. It assesses the economic performance and growth of different states in the country.

Question 11. The System of Regional Accounts (SRA) in India aims to

  1. Calculate the national income of India.
  2. Measure the economic performance of different states and regions within India
  3. Assess the exchange rates between different Indian states
  4. Determine the total imports and exports of each Indian state

Answer: 1. Measure the economic performance of different states and regions within India

Question 12. The Ministry responsible for the compilation of the System of Regional, Accounts in India is

  1. Ministry of Finance
  2. Ministry of Commerce and Industry
  3. Ministry of Home Affairs
  4. Ministry of Statistics and Programme Implementation

Answer: 4. Ministry of Statistics and Programme Implementation

Question 13. The base year used for estimating the System of Regional Accounts in India is generally revised every

  1. 3 years
  2. 5 years
  3. Ignore the impact of international trade on the economy
  4. Focus excessively on government spending

Answer: 2. 5 years

Question 14. The regional accounts data in India provides insights into

  1. The inflation rate in each state
  2. The fiscal deficit of the central government
  3. The economic activities and their contribution to each state’s GDP
  4. The foreign direct investments received by different Indian states

Answer: 3. The economic activities and their contribution to each state’s GDP

Question 15. Which of the following is NOT a component of the System of Regional Accounts in India?

  1. Gross State Domestic Product (GSDP)
  2. Per Capita Income of states
  3. Sectoral distribution of states’ population
  4. International trade data of each state

Answer: 4. Sectoral distribution of states’ population

Question 16. The primary source of data used for compiling the System of Regional Accounts in India is

  1. Annual reports of different state governments
  2. Survey data collected by private agencies
  3. Data from the Reserve Bank of India (RBI)
  4. Data from various government departments and surveys conducted by the Central Statistical Office (CSO)

Answer: 4. Data from various government departments and surveys conducted by the Central Statistical Office (CSO)

Question 17.  The System of Regional Accounts helps in identifying the

  1. Number of state-owned enterprises in each region
  2. Level of unemployment in the country
  3. Disparities in economic growth and development among states
  4. Composition of the national budget

Answer: 3. Disparities in economic growth and development among states

GDP And Welfare

Question 1. Gross Domestic Product (GDP) measures:

  1. The total value of goods and services produced within a country’s border
  2. The total value of goods and services consumed by households.
  3. The total value of goods and services exported by a country.
  4. The total value of goods and services imported by a country.

Answer: 1. The total value of goods and services produced within a country’s border

Explanation:

GDP is a measure of the total economic output produced within a country’s borders during a specific period. It includes the value of all goods and services produced by domestic industries, regardless of whether they are consumed domestically or exported.

Question 2. Which of the following statements is true- regarding the relationship between GDP and welfare?

  1. Higher GDP always leads to higher welfare for all citizens.
  2. Higher GDP guarantees improved living standards for all citizens.
  3. GDP is a comprehensive measure of societal well-being..
  4. GDP per capita is a useful but incomplete indicator of welfare.

Answer: 4. GDP per capita is a useful but incomplete indicator of welfare.

Explanation:

While GDP per capita is a commonly used indicator to assess the • economic well-being of a country’s citizens, it is not a comprehensive measure of welfare. GDP measures the economic output and production but does not directly capture aspects like income distribution, health, education, and environmental quality, which are important determinants of overall welfare.

Question 3. Which of the following factors is NOT considered in the calculation of GDP?

  1. Government spending on infrastructure projects
  2. Investment in new factories and equipment
  3. Income earned by citizens working abroad
  4. Transfer payments, such as social welfare benefits

Answer: 4. Transfer payments, such as social welfare benefits

Explanation: 

Transfer payments, such as social welfare benefits, are not included in the calculation of GDP because they do not represent goods and services produced. GDP measures only the value of final goods and services produced, so transfer payments, which involve the redistribution of income without any production of goods or services, are excluded.

Question 4. Which of the following situations can lead to a discrepancy between GDP growth and citizens’ well-being?

  1. When inflation is high, and GDP growth is low
  2. When income inequality increases during a period of economic expansion
  3. When a country’s exports decrease, and GDP growth slows down
  4. When government spending increases to fund public services and welfare programs

Answer: 2. When income inequality increases during a period of economic expansion

Explanation:

Income inequality can lead to a discrepancy between GDP growth and citizens’ well-being. Economic expansion and GDP growth may benefit certain segments of the population more than others, leading to unequal distribution of income and welfare. In such cases, GDP growth may not reflect the overall improvement in the living standards of all citizens.

Question 5. Which of the following is a limitation of using GDP as a measure of welfare?

  1. GDP does not account for the value of goods and services produced in the informal sector.
  2. GDP does not consider government spending on defense and security.
  3. GDP does not take into account changes in the trade balance.
  4. GDP does not capture the impact of technological advancements on productivity.

Answer: 1. GDP does not account for the value of goods and services produced in the informal sector.

Explanation:

One of the limitations of using GDP as a measure of welfare is that it does not fully account for the value of goods and services produced in the informal sector of the economy, which can be significant in some countries. The informal sector includes activities that are not formally recorded or regulated, such as street vending or unregistered small businesses. These activities contribute to economic output but may not be adequately captured in official GDP calculations. ‘

Question 6. Gross Domestic Product (GDP) is a measure of

  1. The total population of a country
  2. The total value of goods and services produced in a country
  3. The total government spending in a country
  4. The total imports and exports of a country

Answer:  2. The total value of goods and services produced in a country

Explanation:

GDP is a measure of the total value of all final goods and services produced within a country’s borders during a specific period. It is an important indicator of a country’s economic activity and output.

Question 7. Which of the following statements is true regarding GDP and welfare?

  1. A higher GDP always indicates higher welfare for the population.
  2. GDP is unrelated to the well-being and welfare of the population.
  3. GDP is a good indicator of economic growth but does not fully capture the overall welfare of the population.
  4. GDP is a measure of income distribution among the population.

Answer: 3. GDP is a good indicator of economic growth -but does not fully capture the overall welfare of the population.

Explanation:

While GDP is an important indicator of economic growth and activity, it does not provide a comprehensive assessment of the overall well-being or welfare of the population. GDP measures the total economic output and does not take into account factors such as income distribution, inequality, environmental sustainability, and social well-being, which are crucial components of welfare.

Question 8. Which of the following is an example of a limitation of using GDP as a measure of welfare?

  1. GDP includes the value of illegal activities, such as drug trafficking.
  2. GDP accounts for environmental degradation and pollution.
  3. GDP reflects the level of education and healthcare in a country.
  4. GDP considers the distribution of income among different income groups. ‘

Answer: 1. GDP includes the value of illegal activities, such as drug trafficking.

Explanation:

One of the limitations of using GDP as a measure of welfare is that it includes the value of all goods and services produced within a country’s borders, regardless of their legality. This means that illegal activities, such as drug trafficking and other black-market transactions, are also included in the GDP, which can distort the actual welfare level of a country.

Question 9. Which term refers to the total GDP adjusted for inflation or changes in price levels?

  1. Real GDP
  2. Nominal GDP
  3. Per capita GDP
  4. Gross National Product (GNP)

Answer: 1. Real GDP

Explanation:

Real GDP refers to the total GDP of a country that has been adjusted for inflation or changes in price levels. It provides a more accurate measure of economic growth by removing the influence of price changes, over time.

Question 10. Which of the following factors is NOT considered in GDP calculations?

  1. Government spending on infrastructure projects
  2. Private investment in businesses and factories
  3. Household savings and personal investments
  4. Value of intermediate goods used in the production process

Answer: 3. Household savings and personal investments

Explanation:

GDP calculations do not directly consider household savings and personal investments. GDP measures the value of goods and services produced in an economy, including government spending, private investment, and the value of intermediate goods used in the production process. Household savings and personal investments are important for the economy but are not directly included in GDP calculations.

Limitations And Challenges Of National Income Computation

Question 1. Which of the following is a limitation of using Gross Domestic Product (GDP) as a measure of economic welfare?

  1. GDP does not account for changes in the population size.
  2. GDP includes the value of all final goods and services.
  3. GDP considers income distribution among different income groups.
  4. GDP measures the total value of goods and services produced.

Answer: 4. GDP does not account for changes in the population size.

Explanation:

One limitation of using GDP as a measure of economic welfare is that it does not account for changes in the population size. As a result, even if GDP increases, it does not necessarily mean that the standard of living or welfare of the population has improved, especially if the population has grown at a faster rate than GDP. ’

Question 2. Which factor can lead to an overestimation of a country’s GDP?

  1. Inclusion of government transfer payments
  2. Exclusion of household consumption
  3. Exclusion of exports of goods and services.
  4. Inclusion of imports of goods and services

Answer: 1. Inclusion of government transfer payments

Explanation:

The inclusion of government transfer payments (for example social security benefits, and unemployment benefits) in GDP calculations can lead to an overestimation of a country’s GDP. Transfer payments are payments made without the production of goods or services, so including them in GDP would count as the same income twice. .

Question 3. Which aspect is not adequately captured by GDP, making it an incomplete measure of economic performance?

  1. Economic growth rate
  2. Inflation rate
  3. Income distribution
  4. Unemployment rate

Answer: 3. Income distribution

Explanation:

GDP does not directly capture income distribution, among different income groups in the economy. It measures the total economic output, but it does not provide information about how that output is distributed among the population. As a result, it is an incomplete measure of economic performance in terms of assessing income inequality.

Question 4. Which challenge arises due to the difficulty of accurately measuring the informal or underground economy?

  1. Seasonal adjustments
  2. Double-counting of intermediate goods
  3. Price fluctuations. ‘
  4. Shadow economy estimation

Answer: 4. Shadow economy estimation

Explanation:

The challenge of accurately measuring the informal or underground economy is often referred to as “shadow economy estimation.” The informal economy includes economic activities that are not recorded in official statistics, making it challenging to. include them in GDP. calculations. * & .

Question 5. Which of the following is NOT a limitation of using GDP as a measure of well-being?

  1. GDP ignores the value of leisure time and non-market activities.
  2. GDP does not account for environmental degradation and resource depletion.
  3. GDP considers the level of investment in human capital and education.
  4. GDP focuses solely on economic activities and production.

Answer: 3. GDP considers the level of investment in human capital and education. .

Explanation:

One of the limitations of GDP as a measure of well-being is that it does not directly account for the level of investment in human capital and education. GDP primarily focuses on economic activities and the production of goods and services, but it does not fully capture the social and human development aspects of a country.

Question 6. Which of the following is a limitation of using National Income as a measure of economic welfare?

  1. It does not account for income inequality.
  2. It includes the value of illegal activities in the economy.
  3. It is difficult to calculate accurately.
  4. It is not relevant for developed countries.

Answer: 2. It does not account for income inequality.

Explanation:

One of the limitations of using National Income as a measure of economic welfare is that it does not account for income inequality. It provides an aggregate measure of the total income generated in an economy but does not reflect how this income is distributed among different income groups. A country with high GDP or National Income may still experience significant income inequality, impacting the overall well-being of its population.

Question 7. Which challenge arises due to the existence of the informal or underground economy? 

  1. Difficulty in measuring the overall economic output accurately
  2. The inclusion of illegal activities in the GDP calculation
  3. Inflationary pressure on the economy
  4. Increased government expenditure

Answer: 2. Difficulty in measuring the overall economic output accurately

Explanation:

The existence of the informal or underground economy, where certain economic activities are not reported or officially recorded, poses a challenge in accurately measuring the overall economic output. Since such activities are not captured in official records, they can lead to underestimation or inaccurate estimation of National Income or GDP.

Question 8. Which of the following is a limitation of using GDP as an indicator of well-being in terms of environmental sustainability?

  1. GDP includes the value of illegal activities.
  2. GDP does not consider income distribution.
  3. GDP growth may be accompanied by environmental degradation.
  4. GDP does not account for changes in price levels.

Answer: 3. GDP growth may be accompanied by environmental degradation.

Explanation:

One of the limitations of using GDP as an indicator of well-being is that GDP growth may be accompanied by environmental degradation. Economic growth and increased production often lead to increased resource consumption and environmental pollution, which may negatively impact the overall well-being and sustainability in the long term.

Question 9. Which limitation of National Income computation arises due to the exclusion of non-market activities and household production?

  1. Overestimation of economic output
  2. Difficulty in calculating GDP at factor cost
  3. Underestimation of economic output and welfare
  4. Overestimation of economic growth rate

Answer: 3. Underestimation of economic output and welfare Explanation:

The exclusion of non-market activities (for example household work and voluntary services) and household production (e.g., self-consumption of food and goods) from National Income computation leads to an underestimation of the actual economic output and welfare. These activities contribute to the well-being of the population but are not accounted for in GDP calculations.

Question 10. Which challenge arises due to the constant changes in the structure of the economy and the introduction of new goods and services?

  1. Difficulty in calculating the inflation rate
  2. Changes in government policies
  3. Difficulty in measuring real GDP
  4. Difficulty in estimating the savings rate

Answer: 3. Difficulty in measuring real GDP

Explanation:

The constant changes in the structure of the economy, along with the introduction of new goods and services, pose a challenge in accurately measuring real GDP. RealGDP is adjusted for changes in price levels, but it becomes challenging to determine appropriate price deflators for new products and rapidly evolving sectors, making real GDP calculations complex.

Question 11. One of the limitations of national income computation is that it:

  1. Ignores the contribution of the services sector to the economy
  2. Overestimates the value of intermediate goods and services
  3. Excludes the impact of inflation on the economy
  4. Does not consider non-market activities and the informal economy

Answer:  4. Ignores the contribution of the services sector to the economy

Question 12. The challenge of accurately measuring national income arises due to:

  1. Difficulties in collecting data on government spending
  2. Limited availability of data on international trade
  3. The constantly changing structure of the economy
  4. The exclusion of the financial sector from the calculations

Answer: 3. The constantly changing structure of the economy

Question 13. Which of the following is NOT a challenge in computing national income?

  1. Difficulty in accounting for depreciation of assets.
  2. Estimating the value of household production and unpaid work
  3. Dealing with fluctuations in exchange rates
  4. Accounting for income generated from illegal activities.

Answer: 3. Dealing with fluctuations in exchange rates

Question 14. National income computation may not accurately reflect the economic well-being of

  1. The government sector
  2. The manufacturing sector
  3. The agricultural sector
  4. Different income groups within the population

Answer: 4. Different income groups within the population

Question 15. One of the limitations of using Gross Domestic Product (GDP) as a measure of welfare is that it

  1. Does not account for income distribution within the country
  2. Ignores the value of net exports in the economy
  3. Overestimates the contribution of government spending to the economy
  4. Excludes the value of investment spending by businesses

Answer: 1. Does not account for income distribution within the country

Question 16. The concept of national income fails to consider the economic value of

  1. Social Security payments to retirees
  2. Imports of goods and services
  3. Gross fixed capital formation
  4. National debt and government borrowing

Answer: 1. Social Security payments to retirees

Question 17. Which of the following does NOT pose a challenge in calculating Gross National Product (GNP)?

  1. Accounting for the income earned by foreign residents in the country
  2. Estimating the value of exports of goods and services
  3. Dealing with changes in the national currency’s exchange rate
  4. Measuring the value of capital goods used in the production process

Answer: 4. Measuring the value of capital goods used in the production process

CA Foundation Economics Business Cycles Multiple Choice Questions

CA Foundation Economics Business Cycles Multiple Choice Questions

Question 1. Rampant unemployment is found in

  1. Boom
  2. Recovery
  3. Contraction
  4. Depression

Answer: 4. Depression

Because very much unemployment is seen in depression

Question 2. According to economists trade cycle is a purely monetary phenomenon

  1. Schumpeter
  2. Pigou
  3. Hawtrey
  4. Marshall

Answer: 3. Hawtrey

The trade cycle is pure. Monetary phenomenon’ is said by one and only Hawtrey

Question 3. The greatest depression suffered by the economy in that year.

  1. 1924
  2. 1930
  3. 2008
  4. 2009

Answer: 2. 1930

1930 was a year in which the greatest depression suffered by the economy

Question 4. The last stage of recession is called

  1. Depression
  2. Recovery
  3. Slowdown
  4. All of these.

Answer: 1. Depression

Depression is the last stage of recession and does not slow down and
recovery

Question 5. In the long run, a reduction in labor supply would cause output to and the aggregate price level to.

  1. Fall; rise
  2. Fall, fall
  3. Rise, fall
  4. Rise, rise.

Answer: 1. Fall; rise

If a firm in the long run, reduces the supply of labor then it will cause a fall in output with the rise in aggregate price.

Question 6. Which of the following macroeconomic variables would you include in an index of leading economic indicators?

  1. Employment
  2. Inflation
  3. Real interest rates
  4. Residential investment

Answer: 4. Residential investment

The variables that change before the real output changes are called’ leading indicators’. They often change before large economic adjustments. It will include residential investment as one of its variables.

Question 7. Industries that are extremely sensitive to the business cycle are the

  1. Durable goods and service sectors
  2. Nondurable goods and service sectors
  3. Capital goods and non-durable goods sectors
  4. Capital goods and durable goods sectors

Answer:  4. Capital goods and durable goods sectors

Capital goods and durable goods both are of the same nature i.e. long-term period. These goods are extremely sensitive to the business cycle. Without these business can not go smoothly by.

Question 8. An economic variable that moves in the opposite direction as aggregate economic activity down in expansions, up in contractions is called.

  1. Procyclical
  2. Countercyclical
  3. A cyclical
  4. A leading variable

Answer: 2. Countercyclical

An economic variable that moves in the opposite direction as aggregate economic activity (down in expansion and up in contraction) is called counter-cyclical

Question 9. How many phases are there in the business cycle?

  1. Four
  2. Five
  3. One
  4. Many

Answer: 1. Four

The business cycle has 4 Phases; expansion, peak contraction, and trough.

Question 10. The world economy suffered the longest, deepest, and most widespread depression of the 20th century during?

  1. 1934
  2. 1928
  3. 1930
  4. 1932

Answer: 3. 1930

The world economy suffered the most widespread depression of the 20th Century during the 1930s. It started in the US.

Question 11. The business cycle is contagious and in character.

  1. Local
  2. Regional
  3. National
  4. International

Answer: 4. International

The business cycle is International as it affects all over the world.

Question 12. Which External Factor affects the business cycle?

  1. Population growth
  2. Variation in government spending
  3. Money Supply
  4. Macroeconomic policies

Answer: 1. Population growth

Question 13. Which internal factor affects the Business cycle?

  1. Fluctuations in investment
  2. Natural factors
  3. Technology shocks
  4. Population growth

Answer: 1. Fluctuations in investment

Fluctuations in Investment is the Internal factor that affects the business cycle.

Question 14. Whose statement out of these is false?

  1. Hawtrey – ‘Trade cycle is purely Monetary phenomena”
  2. Keynes – “Fluctuations in aggregate Demand”
  3. Pigou – “Fluctuations in investment”
  4. Schumpeter-“Innovations”

Answer: 3. Pigou – “Fluctuations in investment”

According to Pigou, modern business activities are based on the anticipation of the business community and are affected by waves of optimism or pessimism.

Question 15. When once peak is reached, the increase in demand is halted, and then the phase begins.

  1. Trough
  2. Contraction
  3. Expansion
  4. Trend

Answer: 2. Contraction

Once a peak is reached, the increase in demand is halted and starts decreasing in certain sectors and therefore, the phase of contraction begins.

Question 16. Fashion Retailer is a business of?

  1. Cyclical business
  2. Sunrise business
  3. Sluggish business
  4. None of these

Answer: 1. Cyclical business

Businesses whose fortunes are closely related to the rates of economic growth are referred to as cyclical businesses.

Question 17. Features of business cycles include?

  1. Occurs periodically
  2. Have four different phases
  3. Originate in the Free Market Economy
  4. All of the above.

Answer: 4. Originate in the Free Market Economy

Features of the business cycle are:

  •  It occurs periodically although they do not exhibit the same regularity
  • They have four distinct phases.
  • 3. It occurs in a free market economy.
  • It is pervasive

Therefore, is the right option for all of the above.

Question 18. Which of the following is true about leading indicators?

  1. Measurable economic factors
  2. Changes after real output
  3. Both (1) and (2)
  4. None

Answer:  1. Measurable economic factors

A leading indicator is a measurable economic factor that changes before the economy starts following a particular trend/pattern.

Question 19. The internal causes of the business cycle is

  1. Fluctuation in effective demand
  2. Technology shocks
  3. Both (1) and (2)
  4. None

Answer: 1. Fluctuation in effective demand

Business Cycle is the downward and upward movement of Gross Domestic Product (GDP) around its long-term growth trend.

The internal causes of such movement include:

  • Fluctuations in effective demand
  • Fluctuations in investment
  • Variation in government spending
  • Macroeconomic policies
  • Money supply
  • Psychological factors

The external causes are: 

  • Post-war reconstruction
  • Technology shocks
  • Natural factors
  • Population growth.

Question 20. Economics activities will be declining in the phase of

  1. Expansion.
  2. Depression
  3. Contraction
  4. Peak

Answer: 3. Contraction

An expansion is characterized by increasing employment, economic growth, and upward pressure on prices.

  • A peak is the highest point when the economy is at maximum allowable output, full employment.
  • Contraction is characterised where growth slows, economic activities decline pricing pressure subsides.
  • Depression is the point where the economy has hit a bottom from which the next phase of expansion and contraction will emerge.

Question 21. Business Cycle occurs

  1. Periodically
  2. In different phases
  3. Both (1) and (2)
  4. None of the above

Answer: 3. Both (1) and (2)

Business cycles have certain features such as:

It occurs periodically although they do not exhibit the same regularity. Its duration and intensity vary. It has distinct phases of expansion, peak, contraction, and trough with indefinite length.

Question 22. According to some economists, these are the prime causes of business cycles.

  1. Fluctuations in effective demand
  2. Fluctuations in investments
  3. Macroeconomic policies
  4. All of the above

Answer: 2. Fluctuations in investments

Business cycles occur due to various causes which can be both external or internal.

These include:

  • Fluctuations in effective demand
  • Fluctuations in investment (Prime Cause)
  • Variation in Government spending
  • Macroeconomic policies
  • Money supply.

Question 23. Which is not related to the great depression of 1930?

  1. It started in the USA
  2. John Maynard Keynes regarded lower aggregate expenditure as the cause
  3. Excess Money Supply
  4. Both (1) and (2)

Answer:  3. Excess Money Supply

The Great Depression of 1930 started in the US and began worldwide. The British economist John Maynard Keynes regarded lower aggregate expenditures in the economy to be a cause of massive decline in employment and income. The economies of the world came out of recession and entered the expansion phase due to an increase in money supply, international inflow of gold, rise in government spending etc. Related by the great depression of 1930.

Question 24. Which of the following is not the phase of business cycles?

  1. Prosperity
  2. Upswing
  3. Reconstruction
  4. Depression

Answer: 3. Reconstruction

A typical business cycle has 4 distinct phases

  1. Expansiorriupswing
  2. Peak/Prosperity
  3. ContractionDownswing/Recession
  4. Trough/Depression

Business Cycles Typical Business

Question 25. Boom and depression in the business cycle are

  1. Turning point
  2. Equilibrium points
  3. Both (1) and (2)
  4. None of the above

Answer: 1. Turning points

Boom and depression are the turning points. A boom or Peak is the highest point where economic growth stabilizes for a short time and then moves in the reverse direction and the same is true with a trough or depression

Question 26. Which is not the characteristic feature of the expansion phase in the business cycle?

  1. Increase in national output
  2. Unemployment
  3. Rise in price and costs
  4. Boost in business confidence

Answer: 2. Unemployment

The expansion phase in the business cycle is characterized by an increase in national output, more employment opportunities, sales, profits, and rising stock prices.

Prices and costs also tend to rise faster. There is an increase in prosperity, high standard of living, and business confidence. The growth rate slowly reaches to peak. Thus, unemployment is not the characteristic feature of  this phase

Question 27. “Modern business activities are based on the anticipations of the business community and are affected by waves of optimism or pessimism, according to ______________

  1. Pigou
  2. Keynes
  3. Hawtrey
  4. Schumpeter

Answer:  1. Pigou

According to Pigou, “Modern business activities are based on the anticipations of the business community and are affected by waves of . optimistic or pessimism”.

Question 28. Find the odd man out Which of these is not a coincident factor?

  1. Retail sale
  2. Industrial production
  3. Inflation
  4. New orders for plant & machine

Answer: 4. New orders for plant & machine

Coincident indicators also called concurrent indicators, coincide or occur simultaneously with the business-cycle movements.

For Example: (GDP) Gross domestic product

  • Industrial production.
  • Inflation
  • Personal income
  • Retail sale
  • Financial market trends.
  • But new orders for plant and machine is a leading indicator.

Question 29. Excess capacity in capital industries leads to

  1. Peak
  2. Trough
  3. Expansion
  4. Recovery

Answer: 2. Trough

Excess capacity in capital industries leads to a trough a typical feature of depression is the fall in the interest rate. With lower interest rates, the demand for holding liquid money (i.e. in cash) increases. Industries, especially capital, and consumer
durable goods industry suffers from excess capacity. •

Question 30. Here, growth moves in reverse direction

  1. Peak
  2. Expansion
  3. Contraction
  4. Recovery

Answer: 1. Peak

The term peak refers to the top of the highest point of the business cycle. In the later stages of expansion, inputs are difficult to find as they are short of their demand and therefore input prices increase. This is the end of expansion and it occurs when economic growth has reached a point where it will stabilize for a short time and then move in the reverse direction.

Question 31. Frictional unemployment exists in

  1. Peak
  2. Contraction
  3. Expansion
  4. Recovery

Answer: 3. Expansion

Frictional unemployment exists in the expansion phase i.e., there is an increase in national output there is involuntary unemployment is almost zero and whatever unemployment is there is either frictional (i.e. due to a change of jobs, or suspension word due to strikes or due to imperfect mobility of labor etc.

Question 32. In which stage maximum production occurs.

  1. Peak
  2. Expansion
  3. Boom or Expansion
  4. Trough or boom.

Answer: 1. Peak

The term peak refers to the top or highest point of the business cycle. Here in this stage, maximum production occurs. Inputs are difficult to find as they are short of their demand and therefore input prices increase. This stage is the end of expansion and
it occurs when economic growth has reached a point where it will stabilize for a short period.

Question 33. Unemployment is caused due to structural changes is known as?

  1. Ethnic unemployment
  2. Involuntary unemployment
  3. Structural
  4. None

Answer: 3. Structural

Unemployment is caused due to structural changes is known as structural unemployment. It is almost zero and whatever unemployment is there is either fictional (i.e. due to a change of jobs, a strike) or structural unemployment caused due to structural changes in the economy. All these types of unemployment occur in the expansion phase.

Question 34. At trough production is?

  1. High
  2. Low
  3. Negative
  4. None

Answer: 2. Low

At the trough production is low. It is a situation where there is a lower rate of interest people’s demand for holding liquid money (i.e. in cash) increases.

Despite lower interest rates, the demand for credit declines because investors’ confidence has fallen. At the depth of depression, all economic activities touch the bottom and the phase of trough is reached. It is a very agonizing period causing lots of distress for all.

Business Cycles Agonizing Period Causing Lots Of Distress

Question 35. The stage at which actual demand is stagnated?

  1. Peak
  2. Boom or Peak
  3. Contraction
  4. Tough

Answer: 2. Boom or Peak

Peak is a stage at which actual demand stagnates. Peak refers to the top or highest point of the business cycle. Output prices also rise rapidly leading to increased cost of living and greater strain on fixed-income earners.

Consumers begin to review their consumption expenditure on housing, durable goods, etc. Actual demand stagnates. This is the end of expansion and it occurs when economic growth has reached a point where it will stabilize for a short time and then move in the reverse direction.

Question 36. A change of reaction producer cancels their order in which, stage?

  1. Peak
  2. Contraction
  3. Trough
  4. None

Answer: 2. Contraction

Contraction is a stage where the economy cannot endlessly grow. During a contraction, there is a fall in the levels of investment and employment. Producers being aware of the fact that they have indulged in excessive investment and over-production, respond by holding back future investment plans, cancellation, and stoppage of orders for equipment and all types of inputs including labor.

Question 37. Which of the following is true

  1. Depression is a severe form of trough
  2. Depreciation causes a fall in interest rates.
  3. Both (1) and (2)
  4. None

Answer: 1. Depression is a severe form of trough

Depression is a severe form of trough. During this phase of the business cycle growth rate becomes negative and the level of national income and expenditure declines rapidly. Demand for products and services decreases, prices are at their lowest and decline rapidly forcing firms to shut down several production facilities decreases, prices are at their lowest. It is a very agonizing period causing lots of distress for all.

Question 38. China’s recent slowdown caused

  1. A cycle of decline and panic across the world.
  2. Countries across the globe were able to insulate themselves from the crisis.
  3. Stock Markets in emerging economies largely remained unaffected
  4. Old technology fueled the economic decline.

Answer: 1. Cycle of decline and panic across the world.

A decline in China’s economy has caused adverse effects on other countries. It causes decline and panic across the world.

Business cycles are contagious and international. They begin in one country and mostly spread to other countries through trade relations. For example, the great depression of the 1930s in the USA and Great Britain affected almost all the countries, especially the capitalist countries of the world.

Question 39. What of the following are not external causes?

  1. Post-war reconstruction
  2. Population growth
  3. Technology factors
  4. Fluctuation in effective demand.

Answer: 4. Fluctuation in effective demand.

External causes or exogenous factors that may lead to a boom or bust are:

  • Wars
  • Post-war Reconstruction.
  • Technology shocks
  • Natural shocks
  • Population growth
  • Illustration in effective demand is an internal cause.

Question 40. Which of the following phases occurs after the threat and before the peak?

  1. Expansion
  2. Depression
  3. Boom
  4. Recession

Answer: 1. Expansion

Expansion is the phase that occurs after the trough and before the peak. Expansion is characterized by an increase in national output and other economic variables.

Question 41. Which indicators coincide as occur simultaneously with the business cycle movements?

  1. Lagging
  2. Leading
  3. Concurrent
  4. Legal.

Answer: 3. Concurrent

Coincident economic indicators also called concurrent indicators coincide or occur simultaneously with the business cycle movements.

Question 42. What is the most visible sign of recession in an economy?

  1. Fall in the level of employment
  2. Rise in the inventory cost
  3. Full in the price level
  4. Weakening stock market

Answer: 3. Full in price level

Falls in the price level are the most appropriate and visible sign of recession in an economy.

Question 43. The taxation policy of the government is part of

  1. Monetary Policy,
  2. Fiscal Policy
  3. Exim Policy
  4. Industry Policy

Answer: 2. Fiscal Policy

The taxation policy of the government comes under the fiscal policies of the government.

Question 44. During the phase of tough of the business cycle, the growth rate becomes

  1. High
  2. Low
  3. Negative
  4. Zero

Answer: 3. Negative

During the phase trough of the business cycle, the growth rate becomes negative.

Question 45. _________________________ is a measurable economic factor that changes before the economy starts to follow a particular pattern or trend.

  1. Leading indicator
  2. Coincident indicator
  3. Heading indicator
  4. Concurrent indicator

Answer: 1. Leading indicator

A Leading indicator is a measurable economic factor that changes before the economy starts to follow a particular pattern or trend i.e. they change before the real output changes.

Question 46. Which of the following is an internal cause of business cycles?

  1. Wars
  2. Natural factors
  3. Fluctuation in effective demand
  4. Population growth

Answer: 3. Fluctuation in effective demand

Fluctuation in effective demand is the internal causes of the business cycle rest are the external causes of the business cycle.

Question 47. Phases of business cycles are

  1. Expansion, peak, contraction, and trough
  2. Bottom, recession, tough, and boom
  3. Peak, depression, trough, and boom
  4. Peak, depression, bust, and boom

Answer: 1. Expansion, peak, contraction, and trough

Phase of business cycles are : Expansion, peak, contraction, and trough.

Question 48. Which is not an example of a coincident indicator?

  1. Inflation
  2. GDP
  3. Interest rate
  4. Financial market trend

Answer: 3. Financial market trend

Interest rate is not an example of a coincident indicator rest are examples of coincident indicators.

Question 49. During this phase, there is a fall in the level of investment and employment

  1. Contraction
  2. Depression
  3. Boom
  4. Recovery

Answer: 1. Contraction

During the phase of contraction, there is a fall in the level of investment and employment.

Question 50. The most important feature of the business cycle is

  1. Persuasive nature
  2. Regular length
  3. Periodic intensity
  4. None

Answer: 1. Persuasive nature

Persuasive nature is the most important feature of a business cycle.

Question 51. Feature is a fall in interest rates and people’s demand for holding liquid money.

  1. Contraction
  2. Peak
  3. Trough & Depression
  4. Recovery

Answer:  3. Trough and Depression

Feature of Trough and depression is a fall in interest rates and people’s demand to hold liquid money.

Question 52. Businesses that are more vulnerable to changes in the business cycle and whose fortunes are closely linked to the rate of economic growth are called as

  1. Vulnerable Business
  2. Cyclical Business
  3. Leading Business
  4. Lagging Business

Answer: 2. Cyclical Business

Businesses that are more vulnerable to changes in the business cycle and whose features are closely linked to the rate of economic growth are called cyclical businesses.

Question 53. Optimistic and Pessimistic mood of the business community also affects the economic activities is view of __________________.

  1. Hawtrey
  2. Schumpeter
  3. Pigou
  4. Marshall

Answer: 3. Pigou

Optimistic and Pessimistic modes of the business community also affect the economic activities given to Pigou.

Question 54. According to Hawtrey, which of the following is correct?

  1. Trade Cycle occurs as a result of innovation
  2. Trade Cycle is purely a monetary phenomenon
  3. Fluctuation in economic activity is due to fluctuation in demand
  4. Fluctuation in government expenditure

Answer: 2. The Trade Cycle is a purely monetary phenomenon

According to Hawtrey, the Trade cycle is purely a monetary phenomenon.

Question 55. The term business cycle refers to

  1. The ups and downs in the production of commodities
  2. The fluctuation levels of economic activity over some time
  3. Decline in economic activities over a prolonged period
  4. Increasing unemployment rate and diminishing rate of savings

Answer: 2. The fluctuation levels of economic activity over some time

The fluctuating levels of economic activity over some time The term business cycle refers to the fluctuating level of economic activity over some time.

Question 56. During the recession, the unemployment rate and output.

  1. Rises; Falls
  2. Rises; Rises
  3. Falls; Rises
  4. Falls; Falls

Answer: 1. Rises; Falls

During the recession, the unemployment rate rises and output falls.

Question 57. Which of the following is not a characteristic of business cycles?

  1. Business cycles have serious consequences on the well-being of the society
  2. Business cycles occur periodically, although they do not exhibit the same regularity
  3. Business cycles have uniform characteristics and causes
  4. Business cycles are contagious and unpredictable

Answer: 3. Business cycles have uniform characteristics and causes.

Business cycles do not have uniform characteristics and causes,

Question 58. According to ___________________ trade cycles occur due onset of innovations,

  1. Hawtrey
  2. Adam Smith
  3. J, M, Keynes
  4. Schumpeter

Answer: 4. Schumpeter

According to Schumpeter, the trade cycle occurs due to the onset of innovations.

Question 59. A measurable economic factor that changes before the economy starts follows a particular pattern/trend is

  1. Leading Factor
  2. Lagging Factor
  3. Coincident Factor
  4. Concurrent Factor,

Answer: 1.  Leading Factor

A measurable economic factor that changes before the economy starts following a particular trend is a leading factor.

Question 60. Coincident indicators are also known as

  1. Logging indicators
  2. Concurrent indicators
  3. Effective indicators
  4. Leading indicators

Answer: 2. Concurrent indicators

Concurrent indicators Coincident Indicators are

Question 61. The business cycle is contagious

  1. Local
  2. Regional
  3. National
  4. International

Answer: 4.  International ‘

The business cycle is international as it affects all over the world.

Question 62. The world economy suffered the longest deepest and most widespread depression of the 20th century during

  1. 1934
  2. 1928
  3. 1930
  4. 1932

Answer: 3. 1930

The world economy suffered the most widespread depression of the 20th century during the 1930s. It started in the US.

Question 63. The variables that change before the real output change are called as

  1. Leading indicators
  2. Trade cycle
  3. Lagging indicators
  4. Business cycle

Answer: 1. Leading Indicator

A measurable economic factor that changes before the economy starts following a particular trend is known as a leading factor.

Question 64. Which business cycle phases are known as Turning points?

  1. Trough and Depression
  2. Peak and Trough
  3. Expansion and contraction
  4. Peak and Boom

Answer: 2. Peak and Trough

Peaks and troughs of the business cycle are known as collective Turning points.

Question 65. Variables that change after real output changes are known as

  1. Leading indicators
  2. Cyclical indicators
  3. Lagging indicators
  4. Coincident indicators

Answer: 3. Lagging indicators

Variables that change after real output changes are known as lagging indicators.

Question 66. In which of the following phase of a business cycle, does actual demand stagnates?

  1. Expansion
  2. Peak
  3. Contraction
  4. Recovery

Answer: 2. Peak

This is the end of expansion and it occurs when economic growth has reached a point where it will stabilize for a short time “Actual demand stagnates.” In the peak of the business cycle where actual demand stagnates.

Question 67. In a typical business cycle, in which phase supply exceeds demand

  1. Expansion
  2. Peak
  3. Contraction
  4. Recovery

Answer: 3. Contraction

In a Contraction of the business cycle where “Supply exceeds demand”. • The consequence is a mismatch between demand and supply.

Question 68. The rhythmic Fluctuations in aggregate economic activity that an economy experiences over some time is called

  1. Business cycle
  2. Recession
  3. Contraction phase
  4. Recovery

Answer: 1. Business cycle

The rhythmic fluctuations is aggregate economic activities that an economy experiences over some time are called the “Business Cycle”.

Question 69. Which phase of the business cycle is characterized by increase in national output, employment, aggregate demand, capital and consumer expenditure sales, profits, etc.?

  1. Depression
  2. Contraction
  3. Trough
  4. Expansion

Answer: 4. Expansion

The expansion phase is characterized by an increase in National output, employment, aggregate demand, sales, profit, and rising stock prices. These states continue till there is full employment of resources and production is at maximum.

Question 70. Coincident economic indicators are also called as

  1. Leading indicators
  2. Headed indicators
  3. Concurrent indicators
  4. Capacity indicators

Answer: 3. Concurrent indicators

Coincident economic indicators also called concurrent indicators, coincide or occur simultaneously with the business cycle movement.

Question 71. Which of the following is not a feature of the business cycle?

  1. Business cycles are contagious and are international
  2. Business cycles have uniform characteristics and causes
  3. Business cycles have serious consequences on the well-being of the society
  4. The business cycle generally original in free market economics

Answer: 2. Business cycles have uniform characteristics and causes

Business cycles have uniform characteristics and causes. It is not a feature of the Business Cycle.

Features of Business Cycle:

  • Business cycles occur periodically.
  • Business cycles have distinct phases expansion peak, contraction, and trough.
  • Business cycles do not have uniform characteristics and causes.

Question 72. Internal causes of the Business cycle is

  1. Fluctuations in investment
  2. Natural factors
  3. Technology shocks
  4. Population growth

Answer: 1.  Fluctuations in investment

Internal causes of the Business Cycle are: 

  • Fluctuations in Effective Demand.
  • Fluctuations in Investment
  • Variations in government spending
  • Macro Policies.
  • Money” Supply

Question 73. Excess capacity in capital industries leads to

  1. Peak
  2. Trough
  3. Expansion
  4. Recovery

Answer:   2. Trough

Excess capacity in capital industries leads to a trough a typical feature of depression is the fall in the interest rate. With lower interest rates, the demand for holding liquid money (i.e. in cash) increases. Industries, especially the capital and consumer durable goods industry, suffer from excess capacity.

Question 74. According to whom “Business Fluctuation is the outcome of some Psychological states of mind of the business community”:

  1. Marshall
  2. A. C. Pigou
  3. J. K. Hicks
  4. Schumpeter

Answer: 2. A. C. Pigou

According to Pigou, Modern business cycle activities are based on the anticipation of the business community and are affected by waves of optimism or pessimism. Business fluctuation is the outcome of these psychological state of mind of businessmen.

Question 75. _________ is when economic activity is increasing?

  1. Peak
  2. Depression
  3. Expansion
  4. Contraction.

Answer: 3. Expansion

The economy is moving out of recession. Money is cheap to * borrow, businesses build up inventories again and consumers start spending. GDP rises, per capita income grows, unemployment declines, and equity markets generally perform well.

Question 76. __________ is a measurable economic factor that changes at the same time when the economy starts to follow a particular pattern of trend.

  1. Leading Indicators
  2. Coincident Indicator
  3. Lagging Indicator
  4. Heading Indicator.

Answer: 2. Coincident Indicator

A third type of indicator is the coincident indicator. Coincident economic indicators, also called concurrent indicators, coincide or occur simultaneously with the business-cycle movements. Since they coincide fairly closely with changes in the cycle of economic activity, they describe the current state of the business cycle.

In other words, these indicators give information about the rate of change of the expansion or contraction of an economy more or less at the same point of time it happens. A few examples of coincident indicators are Gross Domestic Product, industrial production, inflation, personal income, retail sales, and financial market trends such as stock market prices.

Question 77. According to fluctuations in economic activities are fluctuations in aggregated effective demand.

  1. Keynes
  2. Hawtrey
  3. Pigou
  4. Marshall

Answer: 1. Keynes

According to Keynes, fluctuations in economic activities are due to fluctuations in aggregate effective demand (Effective demand refers to the willingness and ability of. consumers to purchase goods at different prices).

In a free market economy, where maximization of profits is the aim of businesses, a higher level of aggregate demand will induce businessmen to produce more. As a result, there will be more output, income, and employment. However, if aggregate demand outstrips aggregate supply, it causes inflation.

Question 78. ____________ phase is categorized by an increase in national output, employment, aggregate demand, capital & consumer expenditure.

  1. Expansion
  2. Contraction
  3. Peak
  4. Trough

Answer: 1. Expansion

The expansion phase is characterized by an increase in national output, employment, aggregate demand, capital and consumer expenditure, sales, profits, rising stock prices, and bank credit. This state continues till there is full employment of resources and production is at its maximum possible level using the available productive resources.

Involuntary unemployment is almost zero and whatever unemployment is there is either frictional (i.e. due to a change of jobs, suspended work due to strikes or due to imperfect mobility of labor) or structural (i.e. unemployment caused due to structural changes in the economy). Prices and costs also tend to rise faster.

Good amounts of net investment occur, and demand for all types of goods and services rises. There is altogether increasing prosperity and people enjoy a high standard of living due to high levels of consumer spending, business confidence, production, factor incomes, profits, and investment. The growth rate eventually slows down and reaches its peak.

Question 79. In India, Monetary policy is implemented by.

  1. RBI
  2. SEBI
  3. SBI
  4. ICICI

Answer: 1. RBI

The Reserve Bank of India (RBI) is vested with the responsibility of conducting monetary policy. This responsibility is explicitly mandated under the Reserve Bank of India Act, of 1934.

Question 80. The highest point of the business cycle is known as ____________

  1. Peak
  2. Expansion
  3. Contraction
  4. Trough

Answer: 1. Peak

The term peak refers to the top or the highest point of the business cycle. In the later stages of expansion, inputs are difficult to find as they are short of their demand and therefore, input prices increase. Output prices also rise rapidly leading to increased cost of living and greater strain on fixed income earners.

Consumers begin to review their consumption expenditure on housing, durable goods, etc. Actual demand stagnates. This is the end of expansion and it occurs when economic growth has reached a point where it will stabilize for a short time and then move in the reverse direction.

Question 81. Which of the following is characteristic of the business cycle?

  1. It is sporadic
  2. It is contagious
  3. It is complex
  4. They have uniform characteristics

Answer: 2. It is contagious

Business cycles are contagious and are international. They begin in one country and mostly spread to other countries through trade relations. For example, the great depression of the 1930s in the USA and Great Britain affected almost all the countries, especially the capitalist countries of the world.

Question 82. Economic indicators required to predict the turning point of the business cycle is:

  1. Leading Indicator
  2. Lagging Indicator
  3. Coincident
  4. All of the above.

Answer: 4. All of the above

The economic indicators required to predict the turning point of the business cycle are:

  1. Leading indicator
  2. Lagging indicator
  3. Coincident

Question 83. Involuntary unemployment is zero in

  1. Expansion
  2. Peak
  3. Contraction
  4. Trough

Answer: 1. Expansion

In expansion, involuntary unemployment is almost zero and whatever unemployment is there is either frictional or structural.

Question 84. Actual Demand Stagnates in

  1. Expansion
  2. Contraction
  3. Peak
  4. Trough

Answer: 3. Peak

Actual Demand Stagnates when there is an end in expansion and a beginning of a peak. So demand stagnates at “peak”. Here, consumers begin to review their expenditures.

Question 85. A typical feature of depression is the interest rate

  1. Fall
  2. Rise
  3. Constant
  4. None of the above

Answer: 1. Fall

Depression is a severe form of recession for people; demand for liquid money increases resulting in a decrease/fall in interest rates. A fall in interest rate is a typical feature of depression.

Question 86. An indicator that changes after the real output changes?

  1. Lagging Indicator
  2. Coincident indicator
  3. Leading Indicator
  4. Concurrent Indicator

Answer:  1. Lagging Indicator

Lagging indicators reflect the economy’s historical performance they are observable after an economic trend or pattern has already, occurred.

Variables that change after real output changes are “Lagging indicators”.

Question 87. The coincident indicator is also known as

  1. Concurrent Indicator
  2. Lagging Indicator
  3. Leading Indicator
  4. None of the above

Answer: 1. Concurrent Indicator

The coincident indicator is also known as a concurrent indicator as these occur simultaneously with the business cycle movements.

Question 88. What is the leading indicator in the following?

  1. Change in GDP
  2. Change in Stock
  3. Unemployment
  4. Commercial leading Activity

Answer: 2. Change in Stock

Leading indicators are:

  • Changes in stock price.
  • New orders for capital goods.
  • New orders for consumer goods.

Question 89. __________ sector can not be a cyclical business.

  1. Electric goods
  2. House building
  3. Agriculture
  4. Restaurant

Answer: 3. Agriculture

Businesses whose fortunes are closely linked to the rate of economic growth are cyclical businesses.

Examples:  Fashion Retailers, electric goods, restaurants, house building.

Question 90. Which of the following is correct?

  1. Recession is a severe form of depression
  2. Depression is a severe form of recession
  3. In case of depression, interest rates rise
  4. All of the above

Answer: 2. Depression in a severe form of recession

Recession when is a complete and severe contraction in economic activities pushes the economy into phases of depression.

Question 91. The lowest point in the business cycle is referred to as

  1. Peak
  2. Recession
  3. Trough
  4. Expansion

Answer: 3. Trough

The Lowest point in the business cycle is referred as a trough, it is the lowest point of the business cycle in contrast to peak/boom.

Question 92. Which of the following is not the main feature of the business cycle?

  1. Occurs periodically
  2. Profit variation
  3. Worldwide impact
  4. Asynchronous

Answer: 4.  Asynchronous

Reason: There are several features of a Business Cycle given below: 

  • Occurs Periodically
  • Synchronous
  • Major Sectors are Affected
  • Profit Variation
  • Worldwide Impact

Question 93. Which of the following is not an example of cyclical business?

  1. Fashion retailers
  2. House Builders
  3. Restaurants
  4. Washing powder.

Answer: 4. Washing powder

Businesses whose fortunes are closely influenced to the rate of economic growth are referred to as “cyclical” businesses. These include fashion retailers, electrical goods, house-builders, restaurants, advertising, overseas tour operators, construction and other infrastructure firms.

Question 94. A recent example of the business cycle is the housing bubble of the US economy. This bubble burst in

  1. 1930
  2. 1998
  3. 2000
  4. 2007

Answer: 4. 2007

The ‘housing bubble’ of the US economy burst in the second half of 2007.

Question 95. Peaks and troughs of the business cycle are collectively known as

  1. Volatility
  2. Turning points
  3. Equilibrium points
  4. Real business cycle events

Answer: 2. Turning points

Peaks and troughs of the business cycle are collectively known as turning points.

Question 96. Which of the following characteristics does not belong to the expansion path of business cycles?

  1. Consumer spending on goods and services tends to rise
  2. Business confidence tends to rise.
  3. Interest rates and profits tend to rise
  4. Unemployment tends to rise

Answer: 4. Unemployment tends to rise

During the expansion path of business cycles, there is altogether increasing prosperity and people enjoy a high standard of living due to high levels of consumer spending, business confidence, production, factor incomes, profits, and investment. Involuntary
unemployment is almost zero.

Question 97. Which of the following is not a fast-moving consumer goods?

  1. Groceries
  2. Bakery
  3. Confectionaries
  4. Automobile

Answer: 4. Confectionaries

Explanation: Fast-moving consumer goods, also known as consumer packaged goods, are products that are sold quickly and at a relatively low cost. Examples include non-durable household goods such as packaged foods, beverages, toiletries, candies,
cosmetics, over-the-counter drugs, dry goods, and other consumables.

Hence, automobile industry products are not regarded as fast-moving consumer goods.

Question 98. The phase of the business cycle in which the growth rate becomes negative and the level of national income and  expenditure declines rapidly resulting in widespread unemployment:

  1. Contraction
  2. Recession
  3. Depression
  4. Recovery

Answer: 3. Depression

Depression is a severe form of recession and is characterized by extremely sluggish economic activities. During this phase of the business cycle, the growth rate becomes negative and the level of national income and expenditure declines rapidly.

Question 99. Trade cycles occur as a result of a mismatch between the aggregate demand function and aggregate supply functions who said this?

  1. Pigou
  2. Schumpeter
  3. Hawtrey
  4. Keynes

Answer: 4. Keynes

Trade cycles occur as a result of a mismatch between aggregate demand function and aggregate supply functions as said by Keynes.

Question 100. According to ______________ trade cycles occur due to the onset of innovations.

  1. Hawtrey
  2. Adam Smith
  3. J.M. Keynes
  4. Schumpeter

Answer:  4. Schumpeter

According to Schumpeter’s innovation theory, trade cycles occur as a result of innovations that take place in the system from time of time.

Question 101. Which one of the following factors is an external cause or endogenous factor that may lead to a boom or bust?

  1. Economical factor
  2. Social factor
  3. Natural factor
  4. Industrial factor

Answer:  3. Natural factor

External causes of business cycles are:

  • War
  • Post-war reconstruction
  • Technology shock
  • Natural factors
  • Population growth

Question 102. ________________ are the variables that change after the real output changes?

  1. Leading indicator
  2. Lagging indicator
  3. Coincident indicator
  4. Concurrent indicator

Answer: 2. Lagging indicator

Lagging indicators reflect the economy’s historical performance and changes in these indicators are observable only after an economic trend or pattern has already occurred. In other words, variables that change after the real output changes are called ‘Lagging Indicators’.

Question 103. According to monetarists, the prime causes of business cycles are

  1. Change in aggregate demand
  2. Monetary supply
  3. Innovations
  4. Present prices

Answer: 1. Change in aggregate demand

According to some economists, fluctuations in investments are the prime cause of the business cycle. Investment spending is considered to be the most volatile component of the aggregate demand.

Question 104. ‘Corporate profit’ is an example of which type of indicator?

  1. Leading indicator
  2. Coincident indicator
  3. Lagging indicator
  4. Concurrent indicator

Answer: 3. Lagging indicator

Corporate profit is an example of a lagging indicator that changes after real output changes.

Question 105. Coincident indicators are also called as

  1. Lagging indicator
  2. Leading indicator
  3. Concurrent indicators
  4. None

Answer: 3. Concurrent Indicators

Coincident indicators are also called as concurrent indicators

Question 106. An increase in national output and other economic variables is a characteristic of business cycles.

  1. Trough
  2. Depression
  3. Contraction
  4. Expansion

Answer: 4. Expansion

In the expansion phase, national output and all other economic variables increase.

Question 107. Those variables that change before the real output changes before large economic adjustments are called as

  1. Coincident indicator ,
  2. Leading indicator
  3. Concurrent indicator
  4. Lagging indicator

Answer:  2. Leading Indicator

Leading Indicators change before real output changes before large economic adjustments.

Question 108. Which of the following variables charges after real output changes?

  1. Coincident indicator
  2. Lagging indicator
  3. Concurrent indicator
  4. Leading indicator

Answer:  2. Lagging indicator

Lagging indicators show the variance after real output changes.

Question 109. Which of the following is not an internal factor?

  1. Fluctuations in Effective Demand
  2. Fluctuations in Investment
  3. Macro Economic Policies
  4. Post War Reconstruction

Answer: 4. Post-war Reconstruction

Post-war reconstruction is an external factor, not an internal factor

Question 110. In which phase of business cycles, do levels of investment and employment fall? –

  1. Peak
  2. Recession
  3. Expansion
  4. Contraction

Answer: 4. Contraction

Under contraction, the demand falls, investment falls, employment falls and the economy falls.

Question 111. Which of the following is not an example of a lagging indicator?

  1. Consumer price index
  2. Labor cost per unit
  3. Commercial lending
  4. Personal income

Answer: 4. Personal Income

Personal Income is a coincident Indicator, not a lagging indicator.

Question 112. Not a phase of the Business Cycle:

  1. Peak
  2. Trough
  3. Expansion
  4. Reconstruction

Answer: 4. Reconstruction

Reconstruction is not the phase of the business cycle.

Question 113. Which of the following is an Extreme or Exogenous factor, that leads to a boom or burst?

  1. Economic factor
  2. Social factor
  3. Natural factor
  4. Industrial factor

Answer: 3. Natural factor

Natural factors is exogenous. factors that lead to a boom or burst.

Question 114. Which of the following Industries are less sensitive to the Business Cycle?

  1. Consumer Goods Industry
  2. Durable Consumer Goods Industry
  3. Travel and Tourism Business
  4. Food Grain Processing Industries

Answer:  4. Food Grain Processing Industries

Food Grain Processing Industries are less sensitive to business cycles.

Question 115. Which is a feature of the Business Cycle?

  1. Pervasive in Nature
  2. Occurs in Restrictive Market Economy
  3. Periodical Regularity
  4. It has the same reasons

Answer: 1. Pervasive in Nature

Since the business Cycle is a continuous process and it occurs in a flow, hence, it is pervasive.

Question 116. The four phases of the business cycle are:

  1. Peak, recession, trough, and depression
  2. Peak, recession, trough, and boom
  3. Peak, depression, trough, and boom
  4. Peak, depression, burst, and boom

Answer: 2. Peak, recession, trough, and boom

Question 117. Internal causes of depression include

  1. Fluctuation in investments
  2. Money supply
  3. Psychological factors
  4. All of these

Answer: 4. All of these

Question 118. External factors for depression do not include

  1. Population growth.
  2. Technology shocks
  3. Macroeconomic policies
  4. Post-war reconstruction

Answer:  3. Macroeconomic policies

Question 119. The Rhythmic fluctuations in aggregate economic activity over some time are called

  1. Business cycles
  2. Trade cycles
  3. Both  (1)and(2)
  4. None of these

Answer: Both (1) and (2).

Question 120. According to trade cycles occur as a result of innovation which takes place in the system from time to time:

  1. Pigou
  2. Hawtrey
  3. Keynes
  4. Schumpeter

Answer: 4. Schumpeter

Question 121. A severe form of recession is called

  1. Boom
  2. Depression
  3. Trough
  4. Recovery

Answer: 2. Depression

Question 122. Industries that are extremely sensitive to business cycles include

  1. Nondurable goods
  2. Service Sector
  3. Capital goods and durable goods
  4. None of these

Answer: 3. Capital goods and durable cost

Question 123. Peaks and troughs of the business cycles are known collectively as

  1. Turning points
  2. Indicators
  3. Equilibrium points
  4. Contraction

Answer: 1. Turning points.

Question 124. During recession output

  1. Falls
  2. Rises
  3. Expands
  4. None of these.

Answer: 1. Falls

Question 125. Business cycles generally originate in

  1. Free market economies
  2. Imperfect economies
  3. Developed nations
  4. Low growth economies

Answer: 1. Free market economies

Question 126. At the time of the Great Depression of 1930, GDP fell around

  1. 14%
  2. 15%
  3. 20%
  4. 25%

Answer: 2. 15%

Question 127. The highest point of the business cycle is known as:

  1. Trough
  2. Peak
  3. Trend
  4. Boom

Answer: 2. Peak

Question 128. During the slowdown of the economy

  1. GDP is increasing at a fast rate
  2. GDP is increasing at a slow rate
  3. GDP is decreasing at a fast rate
  4. All of these.

Answer: 2. GDP is increasing at a slow rate

Question 129. The economic boom is characterized as a period when

  1. Rising employment
  2. High demand of imported goods
  3. Increase in investments.
  4. All of these

Answer: 4. All of these

Question 130. Which macroeconomic variables are excluded from leading economic indicators

  1. Industrial production
  2. Residential investment
  3. Money supply
  4. Inventory investment

Answer: 1. Industrial production

Question 131. When aggregate economic activity is declining, is the phase of:

  1. Expansion
  2. Contraction
  3. Recovery
  4. Trough

Answer: 2. Contraction

The trade cycle is purely a Monetary phenomenon’ is said by one and only Hawtrey

Question 132. The last stage of recession is called

  1. Depression
  2. Recovery
  3. Slowdown
  4. All of these.

Answer: 1. Depression

Depression is the last stage of recession and not slowdown and recovery

CA Foundation Economics – Price Output Determination Under Different Market Forms MCQs

Price Output Determination Under Different Market Forms Multiple Choice Questions

Question 1. A competitive firm in the short run incurs losses. The firm continues production, if

  1. P > AVC
  2. P = AVC
  3. P < AVC
  4. P ≥ AVC

Answer:  4. P ≥AVC

In the short run, if the competitive firm is incurring losses then it will continue production only if its price is greater or equal to the average variable cost. If the price is less than the variable cost it means neither the fixed cost nor the variable cost can be covered. In such a situation, the producer shall stop production.

Question 2. Under market conditions, firms make normal profits in the long run

  1. Perfect competition.
  2. Monopoly
  3. Oligopoly
  4. None

Answer: 1. Perfect competition.

A perfectly competitive market is characterized by the free entry and exit of firms. In the long run, if the firm makes a profit, more sellers enter the industry and hence the profits are reduced to the equilibrium level. If there are losses, then more firms leave the industry resulting in an increase in profits to the equilibrium level. Hence competitive firms always incur normal profits.

Question 3. A monopolist can maximize his profits when 

  1. His output is maximum
  2. He charges a high price
  3. His average cost is the minimum
  4. His marginal cost is equal to the marginal revenue

Answer: 4. His marginal cost is equal to marginal revenue

Profit maximization level is the level at which :

MC = MR

Question 4. Under which of the following market structures AR of the firm will be equal to MR?

  1. Monopoly
  2. Monopolistic Competition
  3. Oligopoly
  4. Perfect Competition

Answer: 4. Perfect Competition

In perfect competition firms are price takers. Hence they offer the same price i.e. the prices are the same throughout the market. Since the prices are the same or the AR and MR are also equal.

Question 5. Under Monopolistic competition, the cross elasticity of demand for the product of a single firm would be :

  1. Infinite
  2. Highly elastic
  3. Highly inelastic
  4. Zero

Answer: 2. Highly elastic

In the case of monopolistic competition, the products are less differentiated and all the brands are close substitutes of one another hence it has high elastic of cross elasticity.

Question 6. When AR = ₹ 10 and AC = ₹ 8 the firm makes 

  1. Normal profit
  2. Net profit
  3. Gross profit
  4. Supernormal profit

Answer: 4. Supernormal profit

A firm makes a normal profit when AC = AR.

In the given question AR = 10 and AC = 8 i.e. average revenue is greater than average cost. So the firm makes a super normal profit. (Profit above normal profit is super normal profit).

Question 7. What are the conditions for the long-run equilibrium of the competitive firm?

  1. LMC = LAC = P
  2. SMC = SAC = LMC
  3. P = MR
  4. All of these

Answer: 4. All of these

In the long run, competition will be at equilibrium at LMC = LAC = P ’ (When long-run marginal cost, long-run average cost, and price are equal) Also in the long run the firms operating under perfect competition is efficient at point E’

Where P = MR and SMC = SAC = LMC. –

Price Output Determination Under Different Market Forms Equilibrium Of The Compitative Firm

Question 8. The kinked demand curve hypothesis is given by

  1. Alfred marshal
  2. A.C Pigou
  3. Sweezy
  4. Hicks & Allen

Answer: 3. Sweezy

The kinked Demand hypothesis was given by Sweezy, an American economist.

Question 9. Supernormal profits occur, when 

  1. Total revenue is equal to total cost
  2. Total revenue is equal to variable cost
  3. The average revenue is more than the average cost
  4. Average revenue is equal to the average cost

Answer: 3. Average revenue is more than the average cost

Supernormal profits are the profits over and above the normal profit. Normal profit is included in the cost of the product (This profit is for recovering the fixed cost). If the product is sold above its cost supernormal profits occur. In other words, when AR > AC, supernormal profits occur.

Question 10. If under perfect competition, the price line lies below the average cost curve, the firm would 

  1. Make only Normal profits
  2. Incur losses
  3. Make abnormal profit
  4. Profit cannot be determined

Answer: 2. Incur losses

In perfect competition, if the price line (AR and MR curve) is below the AC curve the firm incurs losses i.e. AR or MR is less than AC.

Price Output Determination Under Different Market Perfect Competation Of The Price Line

Question 11. The MR curve cuts the horizontal line between the Y-axis and the demand curve into

  1. Two unequal parts
  2. Two equal parts
  3. May be equal or unequal parts
  4. None of these

Answer: 2. Two equal parts

The slope of the average revenue curve is twice the slope of the marginal revenue curve hence MR curve units it into two equal parts.

Price Output Determination Under Different Market Slope Of Average Revenue Curve

Question 12. The kinked demand curve is observed in _________________

  1. Duopoly market
  2. Monopoly market
  3. Competitive market
  4. Oligopoly market.

Answer: 4. Oligopoly market

In oligopolistic industries, prices remain sticky or inflexible for a long time. They tend to change infrequently even if in the face of declining cost. These inflexibilities lead to the kink shape of the demand curve. Therefore, oligopolistic markets have a kinked demand curve.

Price Output Determination Under Different Market Oligopolistic Markets Have Kinked

Question 13. Competitive firms in the long run earn

  1. Supernormal profit.
  2. Normal profit
  3. Losses
  4. None

Answer: 2. Normal profit

Question 14. For a monopolist, the necessary condition for equilibrium is

  1. P = MC
  2. P = MR = AR
  3. MR = MC
  4. None

Answer: 3. MR = MC

Question 15. A firm is in equilibrium when

  1. MC = MR
  2. Fixed costs exceed revenue
  3. Variable costs exceed revenues
  4. Total costs exceed revenues

Answer: 3. Variable costs exceed revenues

In the short run, the firms will be at a break-even point when variable cost = revenues. When variable cost is above revenues it means that the firm can neither recover its variable cost nor fi/ed cost. In this situation, the producer cannot survive for a long so he may shut down.

Question 16.  __________________ Is the price at which demand for a commodity is equal to its supply

  1. Normal Price
  2. Equilibrium Price
  3. Short run Price
  4. Secular Price

Answer: 2. Equilibrium Price

The equilibrium price is the price at which the demand for a commodity is equal to its supply.

Price Output Determination Under Different Market Equilibrium Price Of A Commodity Equal To Its Supply

Question 17. OPEC is an example of

  1. Monopoly Competition
  2. Monopoly
  3. Oligopoly
  4. Duopoly

Answer:  3. Oligopoly

OPEC Question Organisation for Petroleum Exporting Countries. is an example of an oligopoly market because there are few sellers for petroleum in the world.

Question 18. ________________ Is an ideal Market.

  1. Monopoly
  2. Monopolistic
  3. Perfect Competition
  4. Oligopoly

Answer:  3. Perfect Competition

A perfectly Competitive Market is an ideal Market because it is characterized by many sellers selling identical products to many buyers and there is a freedom of entry and exit.

Question 19. Under this Market Situation demand curve is linear and parallel to the axis 

  1. Perfect Competition
  2. Monopoly
  3. Monopolistic Competition
  4. Oligopoly

Answer: 1. Perfect Competition

Under Perfect competition demand curve is Linear and parallel to X axis because there are a huge number of buyers selling the same commodity at a particular price and as a result, each buyer and seller makes transactions in the market at a prevailing price.

Question 20. Which market has characteristics of product differentiation?

  1. Perfect Competition
  2. Monopoly
  3. Monopolistic Competition
  4. Oligopoly

Answer: 3. Monopolistic Competition

Monopolistic markets have a characteristic of product differentiation which is the most prominent feature of such a form of market where firms do not produce identical goods. They rather produce different varieties of commodities that are close substitutes for each other.

Question 21. Which of these are characteristics of Perfect Competition?

  1. Many Sellers & Buyers
  2. Homogeneous Product
  3. Free Entry and Exit
  4. All of the above

Answer: 4. All of the above

Under perfect competition, there are a large number of buyers and sellers. A particular buyer has a negligible role in determining the price.

The product sold under this type of market structure is homogenous i.e. all units of a good are identical in color, shape, size, or packing of the product of each seller. Lastly; there is no legal or social restriction upon the entry of new firms into the industry. The choice of entering or leaving an industry lies on individual firms.

Question 22. The demand curve of oligopoly is 

  1. Horizontal
  2. Vertical
  3. Kinked
  4. Rising left to right

Answer: 3. Kinked

In many oligopolistic industries, prices remain sticky or inflexible for a long time. This price rigidity has been clearly explained by the kinked demand curve hypothesis. The demand curve of an oligopoly market has a ‘Kink’ at the level of the prevailing prices.

The kink is formed at the prevailing price level. This is because the segment of the demand curve above the prevailing price level is highly elastic and the segment of the demand curve below the prevailing price level is inelastic.

Therefore, the demand curve formed under an oligopolistic market is kinked.

Question 23. MR Curve = AR = Demand Curve is a feature of which kind of Market?

  1. Perfect Competition
  2. Monopoly
  3. Monopolistic
  4. Oligopoly

Answer: 1. Perfect Competition

In perfect competition, all the goods are sold at a single price, by which average revenue (AR) equals marginal revenue (MR). This price is determined by the industry through the forces of demand and supply and this price is adopted by the firms.

All the goods are sold at a prevailing price in the market by which AR equals MR at each level of quantity sold.

Question 24. In the long run, monopolists can

  1. Incur losses
  2. Must earn super-normal profits
  3. Wants to shut-down
  4. Earns only normal profits.

Answer: 2. Must earn super normal profits

The long run is a period long enough to allow the monopolist to adjust his plant size or use his existing plant at any level that maximizes his profit. In the absence of competition, the monopolist need not produce at the optimum level.

Therefore, the monopolist will not continue if he makes losses in the long run. He will continue to make super-normal profits even in the long run as the entry of outside firms is blocked.

Question 25. The demand curve of the firm and industry will be the same in which form of market.

  1. Monopolistic Competition
  2. Perfect Competition
  3. Monopoly
  4. Oligopoly.

Answer: 3. Monopoly

In the case of a monopoly market, the firm and the industry are the same as there is only one seller in the market. Hence the demand curve of the firm and industry are the same.

Question 26. An oligopoly having identical products is

  1. Pure oligopoly
  2. Imperfect oligopoly
  3. Price leadership
  4. Collusion.

Answer: 1. Pure oligopoly

An oligopoly is a market situation when there are few sellers in the market. When the sellers in the market sell homogeneous products, such an oligopoly is termed a pure oligopoly.

Question 27. The demand curve is equal to the M. R. curve in which market?

  1. Oligopoly
  2. Monopoly
  3. Monopolistic Competition
  4. Perfect Competition

Answer: 4. Perfect Competition

In a perfectly competitive market, all units are priced at the same level.

Therefore, P = MR = AR. Since every demand curve is the average revenue curve, so in a perfectly competitive market, the demand
the curve is a straight line parallel to the X-axis, i.e. demand is perfectly elastic. .

Question 28. The kinked demand hypothesis is designed to explain in the context of oligopoly.

  1. Price and output determination
  2. Price rigidity
  3. Collusion between firm
  4. All of the above

Answer: 2. Price rigidity

The kinked demand hypothesis is designed to explain the rigidity of price under an oligopolistic market. It helps to determine the price and output of the firm.

Question 29. Price discrimination can take place only in 

  1. Monopolistic competition
  2. Oligopoly
  3. Perfect competition
  4. Monopoly

Answer: 4. Monopoly

Price discrimination refers to charging different prices to different customers. This is a feature of monopoly, as this situation is possible only in the case of monopoly as there is only one seller in the market and there is no competition.

Question 30. In oligopoly, the kink on the demand curve is more due to _________________

  1. Discontinuity in MR.
  2. Discontinuity in AR.
  3. Fulfillment of the assumption that a price cut is followed by others and a price increase by a firm is not followed by others.
  4. Price war amongst the firms.

Answer: 3. Fulfillment of the assumption that a price cut is followed by others and a price increase by a firm is not followed by others.

In the case of oligopoly, there is akink1 on the demand curve because ‘ the  Segment of demand curve above prevailing price is highly elastic and segment of the demand curve below prevailing price level is inelastic.

The reason for the above is that the oligopolist believes if he lowers the price below the prevailing level its competitors will follow him but if he raises the price above the prevailing level, its competitors will not follow him.

Question 31. Price Discrimination is possible only when.

  1. The seller is alone.
  2. Goods are homogeneous.
  3. The market is controlled by the government.
  4. None of the above.

Answer: 1. Seller is alone.

In the case of price discrimination, there is a condition that the seller should have some control over the supply of his product i.e. monopoly power in some form is necessary (not sufficient) to discriminate price.

So it can be said that to have monopoly power the seller should be alone to exercise price discrimination.

Question 32. Which of the following is not the feature of an imperfect competition?

  1. Product differentiation.
  2. Few sellers.
  3. Homogeneous products.
  4. Price wars.

Answer: 3. Homogeneous products.

Features of imperfect competition are:

  1. A large number of sellers.
  2. Product differentiation
  3. Freedom of Entry or Exit
  4. Non-price competition.

Question 33. Price taker firms.

  1. Do not advertise their product because it misleads the customers.
  2. Advertise their products to boost the level of demand.
  3. Do not advertise but give gifts along with the sold items to attract. customers.
  4. Do not advertise because they can sell as much as they wish at the prevailing price.

Answer: 4. Do not advertise because they can sell as much as they wish at the prevailing price.

In the case of perfect competition, firms are price takers who need not advertise their products because they can sell as much as they wish at the prevailing prices.

Question 34. Price rigidity is a situation found in which of the following market forms?

  1. Perfect competition,
  2. Monopoly.
  3. Monopolistic competition.
  4. Oligopoly.

Answer: 4. Oligopoly.

An oligopoly is a market structure having few sellers characterized by price rigidity which helps to determine the price and output of the firm.

Question 35. When the elasticity of demand is Equal to one in monopoly, marginal Revenue will be_________________

  1. Equal to one.
  2. Greater than one.
  3. Less than one.
  4. Zero.

Answer:   4. Zero.

MR = AR (e-1)/(e)

Where, e= 1

MR = AR (\(\frac{1-1}{1}\))

AR = \(\frac{0}{1}\)

MR = 0

Question 36. Which one of the following statements is Incorrect?

  1. Competitive firms are price takers and not price makers.
  2. Price discrimination is possible in monopoly only.
  3. Duopoly may lead to monopoly.
  4. The competitive firm always seeks to discriminate prices.

Answer: 4. The competitive firm always seeks to discriminate prices.

Monopoly control over the product gives rise to price- discrimination, hence it can take place only in monopolies and not in competitive firms.

Question 37. The toothpaste industry is an example of this.

  1. Monopoly
  2. Monopolistic competition
  3. Oligopoly
  4. Perfect competition.

Answer: 2. Monopolistic competition

Monopolistic competition is a market in which many sellers offer differentiated products to many buyers Example- Toothpaste industry where product differential is only slight, and the degree of control over price is only some.

Question 38. Monopolistic Competitive firms.

  1. Are small in size
  2. Have a small share in the total market
  3. Are very large
  4. Both (1) and (2)

Answer: 4. Both (1) and (2)

Monopolistic competitive firms are small in size compared to. monopolies and every monopolistic competitive firm has small share in the total market Example – Soap industry

Question 39. The price discrimination under monopoly will be possible under which of the following conditions?

  1. The seller has no control over the supply of his product.
  2. The market has the same condition all over
  3. The price elasticity of demand is different in different markets
  4. The price elasticity of demand is uniform.

Answer: 3. The price elasticity of demand is different in different markets

Conditions for price discrimination under monopoly are:

  1. The seller should have control over the supply of his product
  2. The seller should be able to divide his market into sub-markets
  3. The price elasticity of the product should be different in different markets.
  4. Not possible for buyers of low-priced markets to resell the product to buyers of high-priced markets.

Question 40. An oligopoly having identical products is known as 

  1. Pure oligopoly
  2. Collusive oligopoly
  3. Independent oligopoly
  4. None of these.

Answer: 1. Pure oligopoly

An oligopoly having identical products is known as a pure oligopoly. For example industry.

Question 41. Which of these is the best example of oligopoly?

  1. OPEC
  2. SAARC
  3. WTO
  4. GATT.

Answer: 1. OPEC

Oligopoly is defined as competition among few. In other words, when there are few sellers in the market selling homogeneous or differentiated products, an oligopoly is said to exist.

OPEC (Oil and Petroleum Exporting Countries) is the best example of an oligopoly.

Question 42. Monopolists can fix him price of goods whose elasticity is .

  1. Less than 1
  2. More than 1
  3. Elastic
  4. Inelastic.

Answer: 1. Less than 1

Monopoly is a situation when there is a single seller in the market. Here the firm is the price maker. The price elasticity demand for a monopolist is less than one hence he can fix the price of the goods whose elasticity is less than one

Question 43. Perfectly competitive firm faces

  1. The perfectly elastic demand curve
  2. A perfectly inelastic demand curve
  3. Zero
  4. Negative.

Answer: 1. Perfectly elastic demand curve

Firms in a competitive market are price takers. This is because there are a large number of firms in the market who are producing identical or homogeneous products. As such these firms cannot influence the price of their products and hence they have a perfectly elastic demand curve.

Price Output Determination Under Different Market A Firm In a Competative Are Price Takers

Question 44. In perfect Competition when the firm is a price taker, which curve among the following will be a straight line?

  1. Marginal Cost
  2. Average Cost
  3. Total Cost
  4. Marginal Revenue

Answer: 4. Marginal Revenue

In a perfect competitive market the firms are price – takers and the marginal revenue curve Is a straight line.

Price Output Determination Under Different Market Marginal Revenue Curve Is A Straight Line

Firm’s Demand Curve Under Perfect Competition

Question 45. “Price Discrimination” can be best exercised by the Seller in.

  1. Oligopoly
  2. Monopoly
  3. Monopolistic competition
  4. Perfect competition

Answer: 2. Monopoly

Price discrimination cannot persist under perfect competition because the seller does not influence the market-determined rate. Price Discrimination requires an element of monopoly so that the seller can influence the price of his product.

Question 46. A firm encounters a “shut down” point when,

  1. Marginal cost equals the price of the profit-maximizing level of output
  2. Average fixed cost equals the price at the profit-maximizing level of output
  3. Average variable cost equals the price at the profit-maximizing level of output
  4. Average total cost equals the price at the profit-maximizing level of Output

Answer: 3. Average variable cost equals the price at the profit-maximizing level of output

A firm reaches a shutdown level when it is not being able to meet its variable cost. This means that the firm will not be able to make payments to labor, raw material suppliers, etc. In such a situation, the firm will not be able to recover its
variable cost even in the long run. Hence at this stage, the firm should stop production and shut down.

Question 47. Under which market Conditions do firms make only normal profits in the long run?

  1. Oligopoly
  2. Monopoly
  3. Monopolistic competition
  4. Duopoly

Answer: 3. Monopolistic competition

In the short-run, firms earn super-normal profits in the monopolistic competition thus giving incentives to new firms to enter the industry. As more firms enter, profits per firm will decrease as the total demand will be shared among a large number of firms. This will happen till all the profits are wiped away and all the firms earn only normal profits

Question 48. In monopolistic competition excess capacity in the firm ____________________

  1. Always exists
  2. Sometimes exists
  3. Never exists
  4. None of the above

Answer: 1. Always exists

An individual firm in the long run is in an equilibrium position at a position where it has excess capacity. Thus, the firms in monopolistic competition are not of optimum size and there exists excess capacity of production with each firm.

Question 49. Selling costs have to be incurred in case of

  1. Perfect Competition.
  2. Monopolistic Competition
  3. Monopoly
  4. None of these.

Answer: 2. Monopolistic Competition

Nonprice competition is an essential feature of monopolistic competition. Here the firms compete not based on price but on other factors such as aggressive marketing, product development, after-sale services, etc. Hence incurring of selling cost is an essential feature of monopolistic competition.

Question 50. In the market, the price and output equilibrium is determined based on:

  1. Total revenue and total cost
  2. Total cost and marginal cost
  3. Marginal revenue and marginal cost
  4. Only marginal cost.

Answer: 3. Marginal revenue and marginal cost

For the condition of equilibrium, two conditions are necessary

  1. Marginal revenue should be equal to marginal cost.
  2. The marginal cost curve should cut MR from below.
  3. Hence, equilibrium is determined based on marginal cost and marginal revenue.

Question 51. A perfect market is characterized by

  1. Existence of a large number of buyers and sellers
  2. Homogenous products
  3. Perfect knowledge of the market
  4. All of the above.

Answer: 4. All of the above.

A perfect market has the following characteristics :

  • A large number of buyers and sellers
  •  Homogeneous products
  • Free entry and exit
  • Perfect knowledge of the market
  • Movement of goods from one centre to another
  • Uniform price.

Question 52. Which of the following is not a feature of the oligopoly market?

  • Interdependence of the firms in decision-making
  • Price rigidity
  • Group behaviour
  • Existence of a large number of firms.

Answer:  4. Existence of a large number of firms.

Oligopoly is described as ‘competition among the few’. It has the following characteristics:

  1. Interdependence of few firms in decision-making
  2. With the great importance of advertising and selling costs, firms compete on a non-price basis.
  3.  Group behavior.

Question 53. A monopolist can fix

  1. Both price and output
  2. Either price or output
  3. Neither price nor output
  4. None of the above.

Answer: 1. Both price and output

The term ‘monopoly’ means ‘alone to sell’. In a monopoly market, there is only one firm producing or supplying a product. Thus, the monopolist is free to determine both his price and output.

Question 54. In a perfectly competitive market, the demand curve of a firm is

  1. Elastic
  2. Perfectly elastic
  3. Inelastic
  4. Perfectly inelastic

Answer: 2. Perfectly elastic

Firms in a competitive market are price takers. This is because there are a large number of firms in the market who are producing identical or homogeneous products. As such these firms cannot influence the price of their products and hence, they have a perfectly elastic demand curve.

Question 55.  In a competitive market, if the price exceeds the Average Variable Cost (AVC) but remains less than the Average Cost (AC) at the  equilibrium, the firm is

  1. Making a profit
  2. Planning to quit
  3. Experiencing loss but should continue production
  4. Experiencing loss but should discontinue production.

Answer: 3. Experiencing loss but should continue production

The firm can be in an equilibrium position and still make losses. When the firm can meet its VC and a part of FC, it will try to continue production in the short run. If it recovers a part of FC, it will be beneficial for it to continue production because FC are already incurred and in such a case, it will be able to recover a part of them.

Thus, if the price exceeds the AVC but remains less than AC at equilibrium in a competitive market, the firm is experiencing a loss but should continue production.

Question 56. Price under perfect competition is determined by the.

  1. Firm
  2. Industry
  3. Government
  4. Society.

Answer:  2 . Industry

An industry consists of a large number of independent firms, having several factories, firms, or mines under its control. Each such unit in the industry produces a homogeneous product so that there is competition amongst goods produced by different units called firms.

When the total output of the industry is equal to the total demand, we say the industry is in equilibrium, and the price prevailing is the equilibrium price. Thus it can be said that price under perfect competition is determined by industry.

Question 57. Under monopoly, which of the following is correct

  1. AR and MR both are downward sloping
  2. MR lies halfway between AR and Y-axis
  3. MR can be zero or even negative,
  4. All of the above.

Answer: 4. All of the above.

The relationship between AR and MR of a monopoly firm can be stated as follows: 

  • AR and MR are both negative sloped (downward-sloping) curves.
  • MR curve lies halfway between the AR curve and the Y axis, i.e. it cuts the horizontal line between the Y axis and AR into two equal parts.
  • AR cannot be zero, but MR can be zero or even negative. Thus, all of the above statements are correct under monopoly.

Question 58. Non-price competition is very popular in

  1. Monopoly market
  2. Monopolistic competition
  3. Oligopolistic market
  4. Perfect competition.

Answer: 2. Monopolistic competition

In a mono-politically competitive market, sellers try to compete on a basis other than price, such as aggressive advertising, product development, better distribution arrangements, efficient after-sale service, and so on. A key base of non-price competition is a deliberate policy of product differentiation.

Question 59. In the kinked-demand curve model, the upper portion of the demand curve is

  1. Elastic
  2. Inelastic
  3. Perfectly Elastic
  4. Unitary Elastic.

Answer: 1. Elastic

The demand curve faced by an oligopolist according to the kinked demand curve hypothesis, has a kink at the level of the prevailing price. This is because the segment of the demand curve above the prevailing price level is highly elastic and the segment of the demand curve below the prevailing price level is inelastic.

Question 60. The equilibrium price for an industry in perfect competition is fixed.

  1. Input and Output
  2. Market demand and market supply
  3. Market demand and firms’ supply
  4. None of the above.

Answer: 2. Market demand and market supply

Firms in a competitive market are price takers. This is because there are a large number of firms in the market who are producing identical or homogeneous products. As such these firms cannot influence the price in their capacities. They have to accept the price fixed (through the interaction of market demand and supply) by the industry as a whole.

Question 61.  In a perfectly competitive market, if MR is greater than MC, then a firm should

  1. Increase its production
  2. Decrease its production
  3. Decrease its sales
  4. Increase its sales

Answer: 1. Increase its production

In a perfectly competitive market, if MR is greater than MC, there is always an incentive for the firm to expand its production further and gain by selling additional units.

Thus, the firm should increase its production if MR is greater than MC.

Question 62. The kinked demand curve is related to which market structure

  1. Oligopoly
  2. Monopoly
  3. Monopsony
  4. Monopolistic competition.

Answer: 1. Oligopoly

In oligopolistic industries, prices remain sticky or inflexible for a long time. They tend to change infrequently even if in the face of declining cost. These inflexibilities lead to the kink shape of the demand curve.

Therefore, oligopolistic markets have a kinked demand curve.

Price Output Determination Under Different Market Oligopolistic Markets Have Kinked Demand Curve

Question 63. In the long run, a monopolist always earns

  1. Normal profit
  2. Abnormal profit
  3. Zero profit
  4. Loss

Answer: 2. Abnormal profit

The long run is a period long enough to allow the monopolist to adjust his plant size or use his existing plant at any level that maximizes his profit. In the absence of competition, the monopolist need not produce at the optimum level.

Therefore, the monopolist will not continue if he makes losses in the long run. He will continue to make super normal profits even in the long run as entry of outside is blocked.

Question 64. Under which of the following forms of market structure does a firm have very considerable control over the price of its product?

  1. Monopoly
  2. Monopolistic Competition
  3. Oligopoly
  4. Perfect Competition

Answer: 1. Monopoly

In a monopoly, there is a single seller and there is only one firm producing and supplying a product. Each firm is a price maker and is in a position to determine the price of its product.

Question 65. One of the essential conditions of Perfect Competition is

  1. Product differentiation
  2. Many sellers and few buyers
  3. Only one price for identical goods at any one time
  4. The multiplicity of prices for identical products at any one time

Answer: 3. Only one price for identical goods at any one time

In case of perfect competition, the commodity or the goods are sold – at uniform prices throughout the market at any given point in time.

In other words, all firms individually are price takers; they have to accept the price determined by the market forces of demand and supply.

Question 66. The demand cun/e of an oligopolist is 

  1. Determinate
  2. Indeterminate
  3. Circular
  4. Vertical

Answer: 2. Indeterminate

When an oligopolistic firm changes its price, its rival firms will retaliate or react and change their prices which in turn would affect the demand of the former firm. Therefore, an oligopolistic firm cannot have a sure and definite demand curve, since it keeps shifting as the rivals change their prices in reaction to the price changes made by it.

Question 67. Abnormal profits exist in the long run only under

  1. Perfect competition
  2. Monopoly
  3. Monopolistic competition
  4. Oligopoly

Answer:  2. Monopoly

Abnormal profits exist in the long run only under a monopoly. He will continue to make supernormal profits even in the long run as entry of outside firms is blocked.

Question 68. The distinction between a single firm and an Industry vanishes in which of the following market conditions?

  1. Perfect Competition
  2. Imperfect Competition
  3. Pure Competition
  4. Monopoly

Answer:  4. Monopoly

In a monopoly market, there is only one firm producing or supplying a product. This single firm constitutes the industry and as such there is no distinction between firm and industry in a monopolistic market or monopoly.

Question 69. Selling outlay is an essential part of which of the following market situations?

  1. Perfect Competition
  2. Monopoly
  3. Monopolistic Competition
  4. Pure Competition.

Answer: 3. Monopolistic Competition

In a mono-politically competitive market, sellers try to compete based on selling cost/outlay. Sellers attempt to promote their products not by cutting prices but by incurring high expenditure on publicity advertisement and sales promoting techniques. Thus, selling outlay is an essential part of a monopolistic competitive market.

Question 70. The Kinked demand curve model explains the market situation

  1. Pure Oligopoly
  2. Differentiated Oligopoly
  3. Collusive Oligopoly
  4. Price Rigidity

Answer: 4. Price Rigidity

In many oligopolistic industries, prices remain sticky or inflexible for a long time. They tend to change infrequently, even in the face of declining costs. The most popular explanation given for this price rigidity is the kinked demand curve hypothesis given by Paul A. Sweezy.

Question 71. For price discrimination to be successful, the elasticity of demand for the commodity in the two markets should be 

  1. Same
  2. Different
  3. constant
  4. Zero

Answer: 2. Different

Conditions for price discrimination:

  1. The seller should have some control over the supply of his product.
  2. The seller should be able to divide his market into two or more sub-markets.
  3. The price elasticity of the product should be different in different sub-markets.
  4. It should not be possible for buyers of low-priced markets to resell the product to buyers of high-priced markets.

Question 72. The firm in a perfectly competitive market is a price taker. This designation as a price taker is based on the assumption that

  1. The firm has some but not complete control over its product price
  2. There are so many buyers and sellers in the market that anyone buyer or seller cannot affect the market
  3. Each firm produces a homogeneous product
  4. There is easy entry into or exit from the marketplace.

Answer: 2. Each firm produces a homogeneous product

The firm in a perfectly competitive market is a price taker. The designation as a price taker is based on the assumption that there are large numbers of buyers and sellers who compete among themselves and their number is so large that no buyer or seller is in a position to influence the demand or supply in the market.

Question 73. A market structure in which many firms sell products that are similar and identical is known as 

  1. Monopolistic competition
  2. Monopoly
  3. Perfect competition
  4. Oligopoly

Answer: 3. Perfect competition

Perfect competition is a market where a firm sells homogenous products that are similar and identical.

Question 74. A firm having a kinked demand curve indicates that

  1. If the firm reduces the price, competitive firms also reduce the price
  2. If the firm increases the price, competitive firms also increase the price
  3. If the firm reduces the price, competitive firms do not reduce the price
  4. If the firm increases the price, competitive firms do not increase the price

Answer: 2. Both (1) and (4) above

In a firm having a kinked demand curve indicates that the firm has reduced, the price, and the competitive firm also reduces the price but if the firm increases the price, competitive firms do not increase the price.

Question 75. Price discrimination will not be profitable if the elasticity of demand is ______________ In different markets

  1. Uniform
  2. Different
  3. Less
  4. Zero

Answer: 1. Uniform

Price discrimination is a method of pricing adopted by the monopolist to earn abnormal profits. It refers to the practices of charging different prices for different units of the same commodity. Thus, it will not be profitable, if the elasticity of demand is uniform in different markets.

Question 76. In the long run, which of the following statements is true for a firm in a perfectly competitive industry?

  1. It operates at its minimum average cost
  2. The price is more than the average fixed cost
  3. The marginal cost is greater than the marginal revenue
  4. The fixed cost is lower than the total variable cost

Answer: 1. It operates at its minimum average cost

In the long run, plants are used at full capacity, so that there is no wastage of resources i.e. MC = AC. The firm adjusts its plant size to produce that level of output at which the LAC is the minimum.

Thus, we can say that a firm in a perfectly competitive industry operates at its minimum average cost.

Question 77. The firm will attain equilibrium at a point where MC curve cuts from below.

  1. AR curve
  2. MR curve
  3. AC curve
  4. AVC curve.

Answer: 2. MR curve

The MC curve cuts the MR curve from below. In other words, MC should have a positive slope.

Question 78. In a monopoly market, a producer has control only over

  1. Price of the commodity
  2. Demand for the commodity
  3. Both (1) and (2)
  4. Utility of the product.

Answer: 1. Price of the commodity

The monopolist or the producers in a monopoly market may use their monopolistic power to realize maximum revenue and may also adopt price discrimination. Therefore they have control only over the price of the commodity.

Question 79. One of the following is not correct about perfect competition

  1. Purchase and Sale of homogeneous goods
  2. Existence of marketing costs
  3. Absence of transportation costs
  4. Perfect mobility of factors of production.

Answer: 2. Existence of marketing costs

Perfect competition has the following features:

  1. A large number of buyers and sellers of a commodity
  2. Homogeneous Product
  3. Perfect Knowledge
  4. Freedom of Entry and Exit
  5. No Extra Transport Cost
  6. Independent Decision Making
  7. Perfect Mobility

Question 80. The kinked demand curve under oligopoly is designed to show

  1. Price and output determination
  2. Price rigidity
  3. Price leadership
  4. Collusion among rivals.

Answer: 2. Price rigidity

The kinked demand curve hypothesis has a kink’ at the level of the prevailing price. This kink is formed to show price rigidity.

Question 81. “I am making a loss, but with the rent, l have to pay, I can’t afford to shut down at this point.” If this entrepreneur is attempting to maximize profits or minimize losses.

  1. Rational, if the firm is covering its variable cost
  2. Rational, if the firm is covering its fixed cost
  3. Irrational, since plant closing is necessary to eliminate losses
  4. Irrational, since fixed costs are eliminated if a firm shuts down.

Answer: 1. Rational, if the firm is covering its variable cost

A point of operation where a firm is indifferent between continuing operation and shutting down temporarily. The shutdown point is the combination of output and price where a firm earns just enough revenue to cover its total variable costs.

Question 82. The kinked demand curve is the demand curve of

  1. Perfect Competition
  2. Monopoly
  3. Monopolistic Competition
  4. None of the above.

Answer: 4. None of the above.

The kinked demand curve is the demand curve of an oligopoly.

Question 83. Price discrimination will be profitable only if the elasticity of demand in different markets is

  1. Uniform
  2. Different
  3. Less
  4. Zero

Answer: 2. Different

Price discrimination will be profitable only if the elasticity of demand in different markets is different because

Monopolist fixes a high price for their product for those buyers whose price Elasticity of demand for a product is less than one. This implies that when the monopolist charges a higher price from them, they do not significantly reduce their purchases in response to the high price.

Question 84. Under which of the following forms of market structure does a firm have no control over the price of its production?

  1. Monopoly
  2. Monopolistic Competition
  3. Oligopoly
  4. Perfect Competition.

Answer: 4. Perfect Competition.

In perfect competition, a firm has no control over the price of its product because there are large numbers of sellers and each seller produces such a small share of the total output that any change in his output will not have a significant effect

on the market price and there is a large number of buyers so that no buyer can change its output by its action. The firms are said to be ‘price takers’.

Question 85. __________________ Is that situation in which a firm bases its market policy, in part on the expected behavior of a few close rivals.

  1. Oligopoly
  2. Monopolistic Competition
  3. Monopoly
  4. Perfect Competition.

Answer: 1. Oligopoly

Solve questions No. 86, 87, and 88 based on the following figure

Price Output Determination Under Different Market Few Close Rivals

An oligopoly is a market structure in which there is interdependence of firms in decision-making. This is because when the number of competitors are few any change in price, output, or product by a firm will have a direct effect on the fortunes of the rivals, who will then retaliate by changing their price.

Question 86. In the above figure, curve E is the firm’s

  1. Marginal Cost Curve
  2. Average Cost Curve
  3. Demand Curve
  4. Marginal revenue Curve.

Answer: 3. Demand Curve

Curve-E is the Average Revenue curve which is also known as the Demand Curve.

Question 87. The above figure represents a

  1. Monopolist
  2. Perfectly competition industry
  3. Perfectly competitive firm
  4. None of the above.

Answer: 1. Monopolist

  • The given curve is a Monopolist curve because:
  • AR and MR are both negatively sloped
  • MR curve lies half-way between the AR curve and the Y-axis,
  • i. e. it cuts the Horizontal line between the Y-axis and AR into two equal parts.
  • AR cannot be zero, but MR can be zero or negative.

Question 88. In the above figure, the firm’s marginal revenue curve is a curve

  1. E
  2. A
  3. F
  4. B

Answer: 3. F

The marginal revenue curve is curve F because it lies halfway between the AR curve and the Y-axis.

Question 89. The price elasticity of demand for a product is infinite under

  1. Perfect competition
  2. Monopolistic competition
  3. Monopoly
  4. Oligopoly.

Answer: 1. Perfect competition

The price elasticity of demand for a product is infinite under perfect competition as there are large numbers of buyers and sellers who compete among themselves and their number is so large that no buyer or seller is in a position to influence the demand or supply in the market.

Question 90. Comparing a Monopoly and a Competitive firm the Monopolist will

  1. Produce less and sell at a lower price
  2. Produce more and sell at a lower price
  3. Produce less and sell at a higher price
  4. Produce zero and sell at a lower price

Answer: 3. Produce less and sell at a higher price

Monopoly is an extreme form of imperfect competition with a single seller of a product that has no close substitute as compared with a perfectly competitive market. In perfect competition, average and marginal revenue are identical but this is not the case in monopoly as a monopolist knows that if he wishes to increase his sales he will have to reduce the price of a
product. Thus, produce less at a higher price at times.

Question 91. The reason for the kinked demand curve is that

  1. The oligopolists believe that competitors will follow output increases but not output reductions.
  2. The oligopolists believe that competitors will follow price increases but not output reductions.
  3. The oligopolists believe that competitors will follow price cuts but not price rises.
  4. The oligopolists believe that competitors will follow price increases but not output increases

Answer: 3. The oligopolists believe that competitors will follow price cuts but not price rises.

The reason for the Kinked Demand curve is that the oligopolists believe that competitors will follow price cuts but not price rises. This kink is formed at a prevailing price level. This is because the segment of the demand curve above the prevailing price level is highly elastic and the segment of the demand curve below the prevailing price level is inelastic.

Question 92. A discriminating monopolist will charge a higher price in the market in ______________

  1. Which the demand for its product is.
  2. Highly elastic relatively elastic
  3. Relatively inelastic
  4. Perfectly elastic.

Answer: 3. Relatively inelastic

A discriminating monopolist charges a higher price in a market that has a relatively in elastic demand. The market which is highly responsive to price changes is charged less. On the whole, the monopolist benefits from such discrimination.

Question 93. If a firm under monopoly wants to sell more, its average revenue

  1. The curve will be aligned.
  2. Horizontal Vertical
  3. Downward sloping
  4. Upward sloping

Answer: 3. Downward-sloping

If a firm under monopoly wants to sell more, its average revenue curve will be a downward sloping line because the seller charges a single price for all units he sells, average revenue per unit is identical to the price, and thus the market demand curve is the average revenue curve for the monopolist. *

Question 94. Who sets the price of the product under perfect competition?

  1. Government
  2. Consumers
  3. Sellers
  4. Both buyers and sellers

Answer: 4. Both buyers and sellers

The price of the product under perfect competition is set by both buyers and sellers.

Question 95. Which is the first-order condition for the firm to maximize profit.

  1. AC = MR
  2. AC = AR
  3. MC = MR
  4. MR = AR

Answer: 3. MC = MR

The first order condition for the firm to maximize the profits is when marginal cost is equal to the marginal revenue.

Question 96. Which market has the concept of ’group 1 equilibrium in the long run?

  1. Oligopoly
  2. Monopoly
  3. Monopolistic competition
  4. Perfect competition.

Answer: 3. Monopolistic competition

In the long run, monopolistic competition has the concept of group equilibrium. Group equilibrium represents the price and the output of organizations having close substitutes.

Question 97. Which of the following is incorrect?

  1. Even monopolistic can earn losses.
  2. Firms in the perfectly competitive market is price takers.
  3. It is always beneficial for a firm in a perfectly competitive market to discriminative prices.
  4. The kinked demand curve is related to an oligopolistic market.

Answer: 3. It is always beneficial for a firm in a perfectly competitive market to have discriminative prices.

It is always beneficial for a firm in a perfectly competitive market to discriminate prices. This statement is incorrect.

Question 98. The average revenue curve is also known as

  1. Profit Curve
  2. Demand Curve
  3. Average Cost Curve
  4. Indifference Curve

Answer: 2. Demand Curve

Average Revenue curve is also known as Demand Curve

Question 99. Which is not characteristic of monopoly?

  1. The firm is price taker
  2. There is a single firm
  3. The firm produces a unique product
  4. The existence of some advertising.

Answer: 1. The firm is a taker

A monopoly is not a price taker but a price maker.

Question 100. Price discrimination is profitable only when

  1. Different markets are kept separate
  2. Distance between the consumer and the market is more
  3. The elasticity of demand in different markets is different
  4. The consumers are segregated based on their purpose of use of the commodity.

Answer: 3. Elasticity of demand in different markets is different

Price discrimination is profitable only when the elasticity of demand in different markets is different.

Question 101. When the industry is dominated by one large firm which is considered the leader of the group, the market is described as

  1. Open oligopoly
  2. Perfect oligopoly
  3. Partial oligopoly
  4. Organized oligopoly.

Answer: 3. Partial oligopoly

An oligopoly is partial when the industry is dominated by one large firm which is considered or looked upon as the leader of the group. The dominating firm will be the price leader. In partial oligopoly. The market will be conspicuous by the absence of price leadership.

Question 102. Which of the following is not an objective of price discrimination?

  1. To hold the extra stocks
  2. To earn maximum profits
  3. To enjoy economies of scale
  4. To secure equity through pricing.

Answer: 1. To hold the extra stocks

The objectives of price discrimination are here:

  1. To earn maximum profit
  2. To dispose of surplus stock
  3. To enjoy economies of scale
  4. To capture the foreign market
  5. To secure equity through pricing

Question 103. Which of the following statement is not correct? .

  1. Under a monopoly, there is no difference between a firm and an industry.
  2. A monopolist may restrict the output and raise the price.
  3. Commodities offered for sale under perfect competition will be heterogeneous.
  4. Product differentiation is peculiar to monopolistic competition.

Answer: 3. Commodities offered for sale under perfect competition will be heterogeneous.

Commodities offered for sale under perfect competition will be homogenous. There are large numbers of buyers and sellers who compete among themselves and their number is so large that no buyer or seller is in a position to influence the demand and supply in the market being the commodity dealt in it is homogeneous, in the sense that the goods produced by different firms are identical.

Question 104. Under perfect competition, a firm is described as

  1. Price taker and not a price maker
  2. Price maker and not a price taker
  3. Neither the price maker nor the price taker
  4. None of the above.

Answer: 1. Price taker and not price maker

Under perfect competition firms is described as price takers and

not price makers. This is because there are a large number of firms in the market that are producing identical or homogenous » products. As such these firms cannot influence the price in their capacities. They have to accept the price fixed (through the interaction of total demand and total supply) by the industry as a whole.

Question 105. Under which of the following forms of market structure does a firm l have no control over the price of its product?

  1. Monopoly
  2. Monopolistic Competition
  3. Oligopoly
  4. PerfectCompetition.

Answer: 4. Perfect Competition.

Under perfect competition, a firm has no control over the price of its product. Firms have to accept the price as given and as such they are price takers rather than price makers.

They cannot increase the price individually because of the fear of losing the customer to other firms.

Question 106. Condition for the equilibrium of the firm.

  1. MR = MC
  2. AR = AC
  3. MC curve cuts MR curve from below
  4. Both (1) and (2)

Answer: 4. Both (1) and (2)

Conditions for Equilibrium of the firm are

Marginal revenue should be equal to marginal cost i.e. MR = MC

MC curve should cut MR curve from below i.e. MC should have a positive slope. Hence both conditions

Question 107.  What is/are the features of oligopoly

  1. Kinked Demand curve
  2. Cartel
  3. Downward sloping demand curve
  4. Both (1) and (2) are correct

Answer: 4. Both (1) and (2) are correct

An oligopoly is a type of market in which there are only a few buyers and sellers (generally 2 to 10) and it was

So many features also and these are as follows:

  • Cartel
  • Kinked Demand Curve
  • Interdependence
  • Group Behaviour
  • Importance of advertising and selling costs

Question 108. Monopoly is undesirable due to

  1. It has prices higher than competitive firms
  2. It produces less output than competitive firms
  3. It discriminates on prices.
  4. All of the above.

Answer: 4. It discriminates on prices

Monopoly means where only one seller exists and takes all the profits. It has some features from his point of view and undesirable also from

The public point of view these are:

  1. Price Discrimination
  2. Produced less output than competitive firms
  3. Prices are higher than competitive firm

Question 109. In long-run equilibrium, undue perfect competition is/are satisfied by which condition

  1. MC = MR
  2. AC = AR
  3. CMC = LAC = P
  4. All of the above

Answer:  4. All of the above.

The equilibrium point is judged in the long run when there is/are

  • Marginal Cost = Marginal Revenue or MC = MR
  • Average Cost = Average Revenue or AC = AR
  • Long run Marginal Cost = Long Run Average Cost = Price or LMC
    = LAC = P

Question 110. In the long run monopolists

  1. Incur losses
  2. Must earn super-normal profits
  3. Wants to shut down
  4. Earns only normal profits.

Answer: 2.  Must earn super-normal profits

Monopoly means one seller and many buyers. A monopoly is a kind of market in which a seller is known as a monopolist and as his business has grown for a long time then he not only earns normal profits but also abnormal profits which is known as super profits. So, they must earn super-normal profits in the long run.

Question 111. The demand curve of the firm and industry will be the same in which form of the market

  1. Monopolistic competition
  2. Perfect competition
  3. Monopoly
  4. Oligopoly

Answer: 3. Monopoly

The demand curve of the firm and industry will same in the monopoly market as the price is set by the industry and the firm has to choose the level of output that yields maximum profits.

Question 112. The equilibrium price for an industry in perfect competition
is fixed through

  1. Input and output
  2. Market demand and market supply
  3. Market demand and firms’ supply
  4. None of the above.

Answer:  2. Market demand and market supply

Equilibrium is that price at which both demand and supply are equal and therefore, no buyer who wanted to buy at that price becomes dissatisfied and none of the sellers is dissatisfied that they could not sell his goods at that price. The equilibrium price in perfect competition is fixed through Market Supply and Market Demand.

Question 113. Market form in which there is only one buyer and one seller is

  1. Oligopoly
  2. Duopoly
  3. Bilateral Monopoly
  4. Monopsony

Answer:  3. Bilateral Monopoly

A bilateral Monopoly is a type of market in which there are only one seller and one buyer.

Question 114. The structure of the Toothpaste Industry in India is best described as

  1. Perfectly competitive
  2. Monopolistic
  3. Monopolistically competitive
  4. Oligopolistic

Answer: 2. Monopolistic

The monopolistic market has differentiated products with close substitutes just like Toothpaste Industries.

Question 115. Product differentiation is the main feature of which market?

  1. Oligopoly
  2. Monopolistic
  3. Discriminating Monopoly
  4. Perfect competition.

Answer:  2. Monopolistic

In a monopolistic competitive market, there are large numbers of buyers and sellers each selling a differentiated product.

Question 116. Which market has a single seller and single Buyer?

  1. Duopoly
  2. Monopsony
  3. Bilateral Monopoly
  4. None of the above

Answer: 3. Bilateral Monopoly

Bilateral Monopoly is a market structure in which there is only a single buyer and a single seller i.e. it is a combination of a monopoly market and a monopsony market.

Question 117. In the Long run perfect competitive market incurs

  1. Normal profit
  2. Supernormal profit
  3. Losses
  4. Constant Returns

Answer: 1. Normal profit

In the long run, firms will ‘just be earning normal profit because if in the short run, they earning supernormal profit new firms will be attracted and supply will rise which lead to a fall in prices and vice versa.

Question 118. Which one of the following is not the feature of Oligopoly?

  1. Interdependency
  2. Selling cost
  3. Free Entry
  4. None of the above group behavior

Answer:  3. Free Entry

Features of oligopoly are:

  • Strategic Interdependence
  • Importance of advertising and selling cost
  • Group behavior.
  • Therefore, free entry is not a feature of an oligopoly market.

Question 119. Price leadership is the characteristic of

  1. Oligopoly
  2. Monopoly
  3. Perfect competition
  4. Discriminating Monopoly

Answer:  1. Oligopoly

Price leadership can be by a dominant firm, a low-cost firm or it can be barometric price leadership.

Question 120. MR Curve in perfect competition is

  1. Parallel to X- axis
  2. Parallel to Y- axis
  3. Fall from left to right
  4. Rise from left to right

Answer: 1. Parallel to X- axis

MR curve in perfect competition is parallel to the x-axis. Because a perfectly competitive firm is a price taker and faces a horizontal demand curve, its MC curve is also horizontal and coincides with its AC curve.

Question 121. Which of the following is not the characteristic of MR?

  1. When TR is maximum, then MR is zero
  2. MR cannot be negative
  3. MR slopes downward from left to right
  4. MR Curve is below AR Curve

Answer: 2. MR cannot be negative

Properties of MR are:

  • When TR is maximum, then MR is zero
  • MR can be negative
  • MR slopes downward
  • MR curve is below the AR curve
  • Because MR can be negative.

Question 122. Which out of these is not a feature “of perfect competition?

  1. Homogeneous
  2. A large number of buyers and sellers.
  3. Free entry and exit
  4. Selling cost.

Answer: 4. Selling cost.

Feature of a perfectly competitive market

  • A large number of buyers and sellers
  •  Products are homogenous
  • Firms are free to center and exit
  • Consumers have perfect knowledge.
  • Therefore selling cost is not included in a perfectly competitive market ‘ .

Question 123. What is the characteristic feature of monopoly?

  1. Homogeneous goods
  2. Strong barriers to entry
  3. Perfect competition
  4. The perfectly elastic demand curve

Answer:  2. Strong barriers to entry

Monopoly is a market situation in which there is a single seller and a large number of buyers.

Its features are:

  • Single seller of the product
  • Barriers to entry
  • No close-substitute of product
  • Market power.

Question 124. A discriminating monopolist to reach an equilibrium position, his decision on total output depends upon

  1. How much total output should be produced?
  2. How the total output should be distributed between the two sub-markets?
  3. Both (1) and (2)
  4. None

Answer: 3. Both (1) and (2)

To attain an equilibrium position, a discriminating monopolist has to make three main decisions regarding his output.

  1. How much total output should be produced?
  2. How the total output should be distributed between the two
    sub-markets? and.
  3. What price he should change in the two sub-markets?

Question 125. Price discrimination is possible only in

  1. Monopoly
  2. Perfect Competition
  3. Oligopoly
  4. Monopolistic Competition

Answer: 1. Monopoly

Price discrimination is a method of pricing that is adopted by a monopolist to earn abnormal profits. It is a method in which different prices are charged for different units of the same commodity. Thus, this method is only possible in a monopoly market situation.

Question 126. The kinked demand curve is

  1. Highly elastic at above the prevailing price
  2. Inelastic at below the prevailing price
  3. Both (1) and (2)
  4. None of the above

Answer: 3. Both (1) and (2)

In an oligopoly market, the demand curve is kinked-shaped at the level of the prevailing price. The reason behind this is that the demand curve above the prevailing price level is highly elastic and the segment below the prevailing price level is inelastic.

In other words, a high prices, the firm faces relatively elastic demand, and at low prices, relatively inelastic demand.

Price Output Determination Under Different Market Relatively Inelastic Demand

Question 127. The demand curve is horizontal in the case of _________________________

  1. Monopoly
  2. Perfect Competition
  3. Imperfect Competition
  4. Monopolistic Competition

Answer:  2. Perfect Competition

In a perfectly competitive market, firms are price taker i.e. they cannot influence the price in their individual capacity. Price is determined by the industry. Thus, the demand curve of this market is horizontal i.e. parallel to the x-axis.

Price Output Determination Under Different Market Demand Curve Is Horizontal

Question 128. What is the characteristic of monopolistic competition?

  1. Price elasticity is low for the product concerned
  2. A large number of sellers
  3. No degree of control over the price
  4. One buyer

Answer:  2. A large number of sellers

Monopolistic competition is an imperfect market where many producers sell differentiated products.

Its characteristics are:

  •  A large number of sellers.
  •  Product differentiation
  • Freedom of entry and exit
  • Non-price competition

Question 129. If a perfectly competitive firm earns super-normal profits then

  1. AR > MR
  2. AR < MR
  3. AR = MR
  4. None of the above

Answer: 3. AR = MR

In the case of perfect competition, super normal profit arises when its average revenue is more than its average total cost. There is no change in the Demand curve, i.e.

AR = MR = Demand.

Question 130. Live and let live are characteristics of which of the following markets?

  1. Perfect Competition
  2. Monopoly Competition
  3. Imperfect Competition
  4. Oligopoly Competition

Answer:  4. Oligopoly Competition

An oligopoly market forms cartols because thoro are a few firms, all of which are similar in size. Orio’s strategy is to adopt a ‘live and lot live philosophy’. Specifically, the dominant firm accepts the personnel of fringe firms and sets the price to maximize its profit, taking into account the fringe firms’ behavior. This is called price leadership by the dominant firm.

Question 131. In which of the following markets there are there only two sellers?

  1. Duopoly Competition
  2. Perfect Competition
  3. Monopoly Competition
  4. Perfect Competition and Duopoly

Answer:  1. Duopoly Competition

Duopoly Is a subset of an oligopoly, a market situation in which there are only two firms In the market.

Where In an oligopoly market thorn are few firms and a large number of buyers with some degree of control our their prices.

Question 132. The degree of elasticity in a perfect competition market

  1. Perfectly elastic
  2. Inelastic
  3. Perfectly Inelastic
  4. Plastic

Answer:  1. Perfectly elastic

The degree of elasticity in a perfect competition market is perfectly elastic because the firm is a price taker, the demand curve ’I)’ facing an Individual competitive line is given by a horizontal line ul Ilia level of market pi ice set by Ilia industry. In oilier words, the demand caused by each Him is medically (or infinitely) elastic

When a firm earns supernormal profits Its average revenues are more than its average total cost. Thus, in addition to the normal rate of profit, the firm earns some additional profits.

Question 133. A perfectly competitive firm earns supernormal profits when 

In the short run, a competitive firm earns super-normal profits, But in the long run, It earns normal profits only.

  1. ATC < MC
  2. ATC > MC
  3. MR < AR
  4. MR > AR

Answer: 1. ATC < MC

Whon a firm oarns supornormal profits Its avorago rovonuos aro more than its avorago total cost. Thus, in addition to the normal rate of profit, the firm earns some additional profits. The short-run perfect competitive firm earns super normal profits, But in the long run, It earns normal profits only

Price Output Determination Under Different Market Supernormal Profits

Question 134. A firm is said to earn a normal profit when

  1. AC = AR
  2. MC = MR
  3. AR = NR
  4. MC > MR

Answer: 1. AC = AR

When the average revenue of a firm is just equal to its average cost, a firm earns normal profits or zero economic profits, i.e.

AC = AR

It is to be noted that here a normal profit percentage for an entrepreneur for his managerial services is already included in the cost of production.

Question 135. Two firms are selling cold- drinks and competing with some identical characteristics, This is an example of

  1. Duopoly
  2. Monopoly
  3. Oligopoly
  4. Monopolistic

Answer: 1. Duopoly

A duopoly market is the subset of an oligopoly market where two and only two firms are there in the market.

Therefore, when there are two firms of cold- drink that are selling cold- drinks and competing with some identical characteristics. This is an example of a Duopoly market.

Question 136. Group Behaviour is a characteristic of 

  1. Oligopoly
  2. Monopoly
  3. Perfect Competition
  4. Monopolistic Competition.

Answer: 1.  Oligopoly

Group behavior is a characteristic of an oligopoly market. The theory of oligopoly is a theory of group behavior, not mass or individual behavior and to assume profit-maximizing behavior on the oligopolists’ part may not be very valid. The firms may agree to pull together as a group in the promotion of their common interest.

Each oligopolist closely watches the business behavior of the other oligopolists in the industry and designs his moves based on some assumptions of how they are likely to behave.

Question 137. Myth in the Real world

  1. Oligopoly
  2. Duopoly
  3. Perfect Competition
  4. Monopoly

Answer: 3. Perfect Competition

Myth in the Real world is a perfect competition market as in this market there are large numbers of buyers and sellers but they sell all homogenous goods which is not possible in real situation. And here all firms are price-takers.

Price Output Determination Under Different Market Curve Of Perfect Competition

Question 138. _____________ Oligopoly refers to that situation where the firms sell their products through a centralized body.

  1. Syndicate oligopoly
  2. Organized oligopoly
  3. Collusive oligopoly
  4. Partial oligopoly

Answer: 1.  Syndicate oligopoly

Syndicated oligopoly refers to a situation where the firms sell their products through a centralized body.

Organized oligopoly refers to a situation where the firms organize themselves into a central association for fixing prices, output, quotas, etc.

Question 139. The similarity between monopolistic and perfect  competition is

  1. In the short run, both earn super-normal profit
  2. In the long term, both earn a normal profit
  3. In the short run, their prices remain, constant
  4. None

Answer:   2. In the long term both earn normal profit

The similarity between monopolistic and perfect competition is in the long run both earn normal profits. As long run is a period long enough to allow a monopolist to adjust his plant size or use his existing plant at any level that maximizes his profit.

In the absence of competition, the monopolist need not produce at an optimum level. Therefore, the monopolistic will not continue if he makes losses in the long, run. He will continue to make normal profits even in the long run.

Question 140. Which Market has a downward demand curve?

  1. Monopolistic competition
  2. Monopoly
  3. Perfect competition
  4. Both (1) and (2)

Answer:  4. Both (1) and (2)

Monopolistic Competition and Perfect Monopoly competition markets both have downward downward-sloping demand curves.

In all forms of imperfect competition, the average revenue curve of an individual firm slopes downwards as in these market forms when a firm increases the price of its product, its quantity demanded decreases and vice versa.

Price Output Determination Under Different Market AR Demand Curve

Question 141. The kinked demand hypothesis is designed to explain the Oligopolistic market.

  1. Collusion between firms
  2. Price and output determination
  3. Rigidity of price
  4. Price leadership

Answer: 3. Rigidity of price

In the context of oligopoly, the kinked demand curve hypothesis is designed to explain price rigidity. The curve is more elastic above the kink and less elastic below it. This means that the response to a price increase is less than the response to a price decrease.

Question 142. The Aluminum Industry is an example o( which type of oligopoly.

  1. Opon oligopoly
  2. Full oligopoly
  3. Pure oligopoly
  4. Syndicated oligopoly

Answer: 3. Pure oligopoly

In the case of puro oligopoly, the product of different firms In the industry is Identical or homogenous like in the aluminum Industry.

Question 143. In which market price is determined by the market forces of demand and supply?

  1. Pure competition
  2. Perfect competition
  3. Monopolistic competition
  4. Oligopoly

Answer:  1. Pure competition

Perfect competition is a form of the market In which there are a large number of buyers and sellers competing with, each other in the purchase and sale of goods, respectively and no Individual buyer or seller has any influence over the price. Thus, perfect competition is an ideal form of market structure in which there is the greatest degree of competition.

Question 144. Railways charge comparatively cheaper fees to senior citizens. These an examples of

  1. Price discrimination
  2. Market analysis
  3. Profit discrimination
  4. Demand forecasting

Answer: 1. Price discrimination

Railway charges comparatively cheaper foros from senior citizens because It has monopoly power and can practice price discrimination i.o. charging different prices from different customers.

Question 145. Smart Phones market Is an example of

  1. Monopoly
  2. Monopolistic Composition
  3. Oligopoly
  4. Perfect Competition

Answer: 3. Oligopoly

The cell phone industry is an oligopoly because four large firms are competing to produce 70 to 80% of the output.

Question 146. Collusion is impossible if an industry has

  1. A large number of firms
  2. Only flow number of firms
  3. Only two firms
  4. A limited number of firms

Answer: 1. A large number of firms

Collusion is a non-competitive, secret, and sometimes illegal agreement between rivals that attempts to disrupt the market’s equilibrium. The act of collusion involves people or companies which would typically compete against one another, but who conspire to work together to gain an unfair market advantage. Collusion is generally seen in an Oligopoly market hence is not possible in the case of a large number of firms.

Question 147. When the industry is dominated by one large firm it is  called

  1. Partial oligopoly
  2. Full oligopoly
  3. Organized oligopoly
  4. Closed oligopoly

Answer: 1.  Partial oligopoly

Partial oligopoly refers to a market situation where the industry is dominated by one large firm and other firms of the industry follow the price policy determined by their leader.

Question 148. Choose the incorrect statement regarding the barometric price leadership.

  1. Live and let live philosophy is followed
  2. An old and experienced firm acts as a loader
  3. Price decided by assessing market conditions
  4. The price decided by the leader is generally accepted by the rest of  all

Answer: 1. Live and let live philosophy is followed

Barometric price leadership refers to situations in which a’ price leader acts as a barometer of prevailing market conditions for other firms in the industry.

Question 149. Competition among a few is described in

  1. Monopoly
  2. Oligopoly
  3. Duopoly
  4. Monopsony

Answer: 2. Oligopoly

There is no certainty in how firms will compete in oligopoly, it depends upon the objectives of the firm and the nature of the product.

Question 150. Which of the following is not a coalition of perfect competition?

  1. A large number of firms
  2. Perfect mobility of factors
  3. Informative advertising to ensure that consumers have good information
  4. Freedom of entry and exit into and out of the market

Answer: 3. Informative advertising to ensure that consumers have good information

The conditions of a perfect competitive market are as follows:

  • Large no of buyers and sellers
  • Free entry & exist
  • Perfect Substitutes etc.

Question 151. Oligopoly industries are characterized by

  1. A few dominant firms and substantial barriers to entry
  2. A few large firms and no entry barriers
  3. A large number of small firms and no entry barriers
  4. One dominant firm and low entry barriers

Answer: 1. A few dominant firms and substantial barriers to entry

A few dominant firms and substantial barriers to entry Oligopoly industries are characterized by a few dominant firms and substantial barriers to entry.

Question 152. The long-run equilibrium outcomes in monopolistic competition and perfect competition are similar, because in both market structures:

  1. The efficient output level will be produced in the long run
  2. Firms will be producing at a minimum average cost
  3. Firms realize all economies of scale
  4. Firms will only earn normal profit

Answer: 4. Firms will only earn a normal profit

The long-run equilibrium outcomes in monopolistic competition and perfect competition are similar because in both market structures firms will only have normal profits. ‘

Question 153. Pure oligopoly is based on the _________________________ production

  1. Homogeneous
  2. Differential
  3. Unrelated
  4. Related

Answer:  1. Homogeneous

Pure oligopoly is based on Homogeneous production.

Question 154. In The competition of oligopoly, the kinked demand curve hypothesis is designed to explain.

  1. Price rigidity
  2. Price and output determination.
  3. Price leadership
  4. Collusion

Answer:  1. Price Rigidity

In the oligopoly market, the linked demand curve hypothesis is designed to explain price rigidity.

Question 155. Given AR = 5 and elasticity of demand = 2 find MR.

  1. +2.5
  2. -2.5
  3. + 1.5
  4. + 2.0

Answer: 1. +2.5

MR = AR × (e-1)/(e)

= 5 × \(\frac{2-1}{2}\)

= +2.5

Question 156. When TR is max, then MR is

  1. Zero
  2. One
  3. Both (1) and (2)
  4. None

Answer: 1.  Zero

When Total Revenue is max then marginal revenue is Zero.

Price Output Determination Under Different Market Marginal Revenue Is Zero

Question 157. A firm to attain the equilibrium position under perfect competition has ‘ to satisfy which of the following conditions?

  1. MR > MC
  2. MR = MC
  3. MR curve should cut MC curve from below
  4. MC curve should cut MR curve from below

Answer:  4. The MC curve should cut the MR curve from below

Price Output Determination Under Different Market A Firm To Attain The Equilibrium Position

At R, the MC curve is cutting the MR curve from below. Hence, R is the point of equilibrium T, MC curve is cutting the MR curve from above. Hence, T is not the point of equilibrium.

Question 158. Electricity companies sell electricity at a cheaper rate for power consumption in rural areas than for industrial consumption. This is an example of

  1. Product discrimination
  2. Perfect competition
  3. Price discrimination
  4. Price taker

Answer: 3. Price discrimination

Price discrimination is a method of pricing that is adopted by a Monopolist to earn abnormal profit. It is a method in which different prices are charged for different units of the same commodity.

Question 159. Which of the following is an example of monopolistic competition?

  1. De Beers and Diamonds
  2. Hotel and Pubs
  3. Microsoft and window
  4. Dell and Lenovo

Answer:  2. Hotel and Pubs

In Monopolistic competition, large number of buyers and a large number of firms in the industry. Differentiated products that are close substitutes but not perfect substitutes Example: Hotels and Pubs.

Question 160. Who propounded the price rigidity under kinked demand curve model of oligopoly?

  1. Adam Smith
  2. Karl Marx
  3. Keynes
  4. Paul A. Sweezy

Answer: 4. Paul A. Sweezy

American economist Paul A. Sweezy propounded the price rigidity under the kinked demand curve model of oligopoly.

Question 161. The demand for generic goods like soap is ________________ the demand for Lux soap is ________________

  1. Inelastic, elastic
  2. Elastic, inelastic
  3. Inelastic, inelastic
  4. Elastic, elastic

Answer:  4. Elastic, elastic

The demand for generic goods like soap is elastic the demand for LUX soap is elastic.

Question 162. Zero economic profit emerges due to which of the following conditions?

  1. The average revenue is more than the average total cost.
  2. Marginal revenue is just equal to marginal cost.
  3. Marginal revenue is just not equal to marginal cost.
  4. Average revenue is just equal to the average total cost.

Answer:  4. Average revenue is just equal to the average total cost.

Zero economic profit emerges because to average revenue is just equal to the average total cost.

Question 163. Non-price competition is observed in which type of the following market?

  1. Monopoly
  2. Monopolistic competition
  3. Duopoly
  4. Oligopoly

Answer: 2. Monopolistic competition

Non-price competition is observed in the monopolistic competition market.

Features of monopolistic competition are:

  1. Product differentiation
  2. Freedom of entry and exit
  3. Large numbers of buyers and sellers
  4. Non-price competition

Question 164. A group of firms that explicitly agree (collude) to coordinate their activities is called a/an.

  1. Oligopoly
  2. Duopoly
  3. Monopoly
  4. Cartel

Answer: 4. Cartel

Cartels are often formed in industries where there are few firms all of which are similar in size. A group of firms that explicitly agree to coordinate their activities is known as a cartel.

Question 165. Which one of the following is not a characteristic of oligopoly?

  1. Strategic interdependence
  2. A large number of firms selling close substitutes.
  3. Importance of selling cost
  4. Group behaviour

Answer: 2. Large number of firms selling close substitutes.

Large numbers of firms selling close substitutes is not a feature of oligopoly.

Features of oligopoly are: 

  1. Few firms or sellers
  2. Example: Cold drinks

Question 166. Which of the following is not a feature of the monopoly market?

  1. Large seller of the product
  2. No close – substitutes
  3. Market, power
  4. Single seller of the product

Answer: 1. Large seller of the product

Features of the monopoly market are:

  1. Single seller of the product
  2. Barriers to Entry
  3. No close substitutes
  4. Market power

Question 167. Price discrimination refers to charging ____________________ prices for units of  _________________ commodity. 

  1. Different, different, same
  2. Different, same, same
  3. Same, different, same
  4. Same, same, different

Answer: 1. Different, different, same

Price discrimination is a method of pricing adopted by a monopolist to earn abnormal profits. It refers to the practices of charging different prices for different units of the same commodity.

Price discrimination is a selling strategy that charges customers different prices for the same product or service based on what the seller thinks they can get the customer to agree to. In pure price discrimination, the seller charges each customer the maximum price they will pay.

Question 168. There are 4 firms in the market

Price Output Determination Under Different Market Firms And Markets

Which type of market structure can be most suitable here?

  1. Oligopoly
  2. Monopoly
  3. Monopolistic
  4. Perfect Competition

Answer:  1. Oligopoly

Oligopoly is often described as ‘competition among the few’. Prof. Stigler defines oligopoly as a “situation in which a  firm bases its market policy, in part, on the expected behavior of a few close rivals”. In other words, when there are few (two to ten) sellers in a market selling homogeneous or differentiated products, an oligopoly is said to exist.

Oligopolies mostly arise due to those factors which are responsible for the emergence of monopolies. Unlike a monopoly where a single firm enjoys absolute market power, under an oligopoly a few firms exercise their power to keep possible competitors out.

Question 169. A market condition in which there is only a single seller and a single buyer.

  1. Monopsony
  2. Bilateral Monopoly
  3. Monopolistic Competition
  4. Oligopoly.

Answer: 2. Bilateral Monopoly

A bilateral monopoly exists when a market has only one supplier • and one buyer. The one supplier will tend to act as a monopoly power and look to charge high prices to the one buyer.’ The lone buyer will look towards paying a price that is as low as possible.

Question 170. Charging lower prices from senior citizens for railway tickets is an example of

  1. Subsidized pricing
  2. Concessional pricing
  3. Price discrimination
  4. Product pricing

Answer: 3. Price discrimination

Under third-degree price discrimination, price varies by attributes such as location or by customer segment. Here the monopolist will divide the consumers into separate sub-markets and charge different prices in different sub-markets.

Examples:   Dumping, charging different prices for domestic and commercial uses, lower prices in railways for senior citizens, etc.

Question 171. Which of the following is not a characteristic of perfect competition

  1. A large no. of sellers and buyers
  2. Freedom of entry and exit
  3. Inefficient allocation of resources
  4. Homogeneous Product.

Answer: 3. Inefficient allocation of resources

Inefficient allocation of resources is not a characteristic of perfect competition. A market is said to be perfectly  competitive if it has large number of buyers and sellers, homogeneous product, free entry and exit, perfect mobility of factors of production, perfect

knowledge about the market conditions, insignificant transaction costs, no government interference, and absence of collusion.

Question 172. When the industry is dominated by one large firm, then it is .

  1. Full oligopoly
  2. Syndicated oligopoly
  3. Organized oligopoly
  4. Partial oligopoly

Answer: 4. Partial oligopoly

When the industry is dominated by one large firm, then it is a partial oligopoly. Oligopoly is a form of imperfect competition and is usually described as competition among a few. Hence, Oligopoly exists when there are two to ten sellers in a market selling homogeneous or differentiated products. These firms sell homogeneous as well as differentiated products in the market.

Question 173. In an oligopoly, sellers try to act as

  1. Price taker
  2. Price maker
  3. Price indicators
  4. Price barriers

Answer: 1. Price taker

Oligopolies are price setters (makers) rather than price takers. Barriers to entry are high. The most important barriers are government licenses, economies of scale, patents, access to expensive and complex technology, and strategic actions by incumbent firms designed to discourage or destroy nascent firms.

Question 174. The kinked demand curve is designed to explain

  1. Price and output determination
  2. Price rigidity
  3. Price leadership
  4. Collusion among rivals

Answer: 2. Price rigidity

In the context of oligopoly, the kinked demand curve hypothesis is designed to explain Price rigidity. The curve is more elastic above the kink and less elastic below it. This means that the response to a price increase is less than the response to a price decrease

Question 175. In the case of monopoly, the price elasticity of demand is

  1. Elastic
  2. More elastic
  3. Negative
  4. Infinite

Answer: 3. More elastic

Monopoly power, also called market power, is the ability to set price. Firms with market power face a downward-sloping demand curve. Hence, negative.

Question 176. The kinked demand curve model of oligopoly assumes that

  1. The response (of consumers) to a price increase is less than the response to a price decrease
  2. The response (of consumers) to a price increase is more than the response to a price decrease
  3. The elasticity of Demand is constant
  4. Demand is perfectly elastic.

Answer: 1. The response (of consumers) to a price increase is less than the response to a price decrease

The kinked demand curve model of oligopoly assumes that the response to a price increase is less than the response to a price decrease, the response to a price increase is more than the response to a price decrease. The elasticity of demand is constant regardless of whether the price increases or decreases.

Question 177. In which form of the market structure is the degree of control over the price of its product by a firm is very large?

  1. Monopoly
  2. Imperfect competition
  3. Oligopoly
  4. Perfect competition

Answer: 1. Monopoly

In a monopolistic market structure, the degree of control over the price of its product by a firm is very large.

Question 178. Under perfect competition in the long run there will be

  1. Normal profit
  2. Supernormal profit
  3. Production
  4. Cost

Answer: 1. Normal profit

In perfect competition, in the long run, there will be Normal profits. Perfect Competition Long Run equilibrium results in ail
firms receiving normal profits or zero economic profits.

Question 179. The degree of control over price is very considerable in

  1. Monopoly
  2. Perfect competition
  3. Oligopoly
  4. Monopolistic competition

Answer: 1. Monopoly

In a Monopoly market structure, the degree of control over the price of its product by a firm is very large. In a monopoly type of market structure, there is only one seller, so a single firm will control the entire market. It can set any price it wishes since it has all the market powers. Consumers do not have any alternative and must pay the price set by the seller.

Question 180. In which of the market firms does price discrimination not persist?

  1. Monopoly
  2. Oligopoly
  3. Monopolistic Competition
  4. Perfect Competition.

Answer: 4. Perfect Competition

In a monopoly, the seller adopts this method of pricing to earn abnormal profits. It is important to remember that price discrimination cannot persist under perfect competition since the seller has no control over the market price of the product/service.

Question 181. Nuclear Power represents which type of market structure

  1. Government Monopoly
  2. Perfect Competition
  3. Monopolistic Competition
  4. Oligopoly

Answer: 1. Government Monopoly

Nuclear power represents a government monopoly type of market. structure.

Question 182. The monopoly market and Monopsony market combination is called

  1. Duopoly Market
  2. Oligopoly Market
  3. Bilateral Monopoly Market
  4. Monopolistic Market

Answer: 3. Bilateral Monopoly Market

A monopoly market and monopsony market combination is called as bilateral monopoly market.

Question 183. The marginal revenue curve listens to the demand curve in monopolistic competition due to

  1. Below; product differentiation
  2. Above; Barriers to entry
  3. Above; Product-differentiation
  4. None of these

Answer: 1. Below; product differentiation

The marginal revenue curve lies below its demand curve in monopolistic competition due to product differentiation.

Question 184. In monopoly MR is AR.

  1. Less than
  2. Greater than
  3. Equal
  4. Any of the above

Answer: 1. Less than

In monopoly, MR is always less than AR, as AR i.e prices are always greater than marginal revenue to earn economic profit.

Question 185. Non- Price competition typically occurs within

  1. Monopoly
  2. Perfect Competition
  3. Monopolistic
  4. Oligopoly

Answer: 3. Monopolistic

A monopolistic competition has non-price competition. In nonprice competition all firms are safe and they don’t need to reduce their profit margins.

Sellers attempt to provide and promote their products not by cutting prices but by incurring expenditure on publicity and
advertisement.

Question 186. On the upper side of the kinked demand curve, what is the elasticity of

  1. Less elastic
  2. Inelastic
  3. Relatively elastic
  4. Infinite

Answer: 3. Relatively elastic

On the upper side of the kinked demand curve elasticity of demand is relatively more elastic than the elasticity on the lower side of the demand curve.

Question 187. Price rigidity is a concept of 

  1. Perfect competition
  2. Monopoly
  3. Monopolistic
  4. Oligopoly

Answer: 4. Oligopoly

Price rigidity is a feature of oligopoly as price does not change easily in response to changes in demand. If a firm raises the price others keep constant. Hence, it is not rational to keep prices increasing, so prices are rigid.

Question 188. A firm should produce fill MC _____________ MR

  1. Greater
  2. Less
  3. Equal
  4. All of the above

Answer: 3. Equal

According to economic theory, a firm expands production until the point marginal cost is equal to marginal revenue

Question 189. Which of the following statements is correct?

  1. Price rigidity is an important feature of monopoly
  2. Selling Costs are possible under perfect conditions. ,
  3. Under perfect competition factor of production do not move freely as there are legal restrictions
  4. An industry consists of many firms

Answer: 4. An industry consists of many firms

Price rigidity is an important feature of an oligopoly and not a monopoly. Selling costs are not possible under perfect competition as well as a monopoly market. Under perfect competition, there is freedom of entry and exit.An industry consists of various firms. Hence, option (d) is correct.

Question 190. In this type of market, there are large numbers of buyers and sellers with identical products

  1. Imperfect competition.
  2. Oligopoly
  3. Perfect competition
  4. Monopolistic competition

Answer: 3. Perfect competition

Features of perfect competition:

  • A large number of buyers and sellers.
  • Homogenous/identical products.
  • Free entry and exit.
  • Perfect knowledge of the market conditions on the part of buyers and sellers.
  • Negligible transaction costs.
  • All firms are individual price takers.

Question 191. The kinked demand curve is also known as

  1. Sweezy’s model
  2. Adam’s model
  3. Revisionary model
  4. Economic trade model

Answer: 1. Sweezy’s model

The kinked demand curve hypothesis was given by an American economist Paul A Sweezy. Hence, this is called Sweezy’s model.

Question 192. On the upper part of the kinked demand curve, the demand is

  1. Elastic
  2. Inelastic
  3. Neutral
  4. None of the above

Answer: 1. Elastic

The upper segment of the kinked demand curve is relatively elastic and the lower segment is relatively inelastic. The difference in elasticities is due to the particular competitive reaction pattern assumed by the kinked demand curve hypothesis.

Question 193. The long-run equilibrium of a competitive firm is achieved at

  1. LAR = LMR = P = LMC = LAC
  2. LMR = LAR = LMC +1 = LAC
  3. LAR = LMR +1 = P+1 = LAC
  4. P = LMC = LAC – LMR + LAR

Answer: 1. LAR = LMR = P = LMC = LAC

In the long run, under perfect competition, the market mechanism leads to optimal allocation of resources. The optimality is shown by

The following outcomes are associated with the long-run equilibrium of the industry:

  • The output is produced at the minimum feasible cost
  • Consumers pay the minimum possible price which just covers the marginal cost i.e.
  • MC = AR. (P = MC)
  • Plants are used to fully capacity in the long run, so that there is no wastage of resources i.e. (MC = AC)
  • The firm earns only normal profits i.e. AC = MR
  • Firms maximize profits (i.e, MC = MR), but the level of profits will be just normal
  • There is an optimum number of firms in the industry.
  • LAR = LMR = P = LMC = LAC

Question 194. The producer is an oligopolistic market that fixes its price at

  1. A price less than the price charged by a monopoly as well as a perfectly competitive market.
  2. A price more than the price charged by a perfectly competitive market as well as a monopoly
  3. A price higher than the one charged by a monopoly and less than that of a perfectly competitive market.
  4. A price higher than that charged by a perfectly competitive market and less than that of a monopoly.

Answer: 4. A price higher than that charged by a perfectly competitive market and less than that of a monopoly

The producer in an oligopolistic market fixes its price at a price higher than that charged by a perfectly competitive market and less than that of a monopoly.

Question 195. Which of the following is a behavior of oligopoly?

  1. Group behaviour
  2. Individual behavior
  3. Relative behaviour
  4. None of the above

Answer: 1. Group behavior

The theory of oligopoly is a theory of group behavior, not of mass or individual behavior, and assumes profit-maximizing behavior.

Question 196. Where there are a large number of letters in a market and there is a very high degree of competition between them, the elasticity of supply is

  1. Infinite
  2. Zero
  3. More than one
  4. Less than one

Answer: 2. Zero

Where there are a large number of sellers in a market, and there is a very high degree of competition between them, the elasticity of supply is zero.

Question 197. Which of the following markets may earn supernormal profit in the long run

  1. Perfect competition
  2. Monopoly
  3. Monopolistic
  4. None of these

Answer: 2. Monopoly

Monopoly being only a single seller in the market can earn supernormal profits in the long run.

Question 198. “Product differentiation” is characteristic of

  1. Perfect competition
  2. Monopolistic competition.
  3. Oligopoly competition
  4. Duopoly competition

Answer: 2. Oligopoly competition

Product Differentiation is an essential feature of Monopolistic competition.

Question 199. The “Kinked demand curve” hypothesis explains which of the following concepts?

  1. Price leadership
  2. Price rigidity
  3. Group behaviour
  4. Independent pricing

Answer: 2. Price rigidity

The “Kinked Demand Curve” in Oligopoly explains the concept of Price rigidity.

Question 200. In which type of Market, the product is homogeneous?

  1. Pure Oligopoly.
  2. Pure Monopoly
  3. Pure Duopoly
  4. Pure Competition

Answer: 4. Pure Competition

Pure Competition is a market where there are a large number of buyers and sellers dealing with the same homogeneous goods and there is free to entry and free exit.

Question 201. When a new firm enters the market and competes with the existing firm is a situation called?

  1. Open Oligopoly
  2. Open Oligopoly
  3. Collusive Oligopoly
  4. Competitive Oligopoly

Answer: 1. Open Oligopoly

Based on entry and exit, an oligopoly is classified as an open oligopoly or closed oligopoly. Here, new firms are entering and competing with existing firms. It is an open oligopoly.

Question 202. Which of the following is characteristic of Monopoly?

  1. The industry is dominated by a larger no. of firms
  2. Freedom to entry and exit.
  3. No close substitutes
  4. Only two firms in the market

Answer: 3. No close substitutes

Monopoly is characterized by No close substitutes and a Single

Question 203. Not an objective of Price Discrimination?

  1. To enjoy Economics of scale
  2. To dispose of surplus stock
  3. To escape the foreign market
  4. To secure equity through pricing

Answer: 3. To escape foreign market

To Escape Foreign Market

To escape a foreign market is not an objective of price discrimination. Monopoly is characterized by No close substitutes and Single sellers.

CA Foundation Economics Determination Of Prices Multiple Choice Questions

Determination Of Prices Multiple Choice Questions

Question 1. For maximum profit, the condition is 

  1. AR =AC.
  2. MR – MC
  3. MR = AR
  4. MC = AR

Answer:  2. MR – MC

The profit maximization level of a firm is the level at which its marginal revenue is equal to marginal cost. The condition for maximum profit is MC = MR.

Question 2. Equilibrium price may be determined through

  1. Only demand
  2. Only supply
  3. Both demand & supply
  4. None

Answer: 3. Both demand & supply

The equilibrium price is the price of a product when its demand equals supply. The point of intersection of demand and supply curves is the equilibrium price.

Determination Of Prices Equilibrium Price Involves Both Demand And Supply

Question 3. If the price is forced to stay below the equilibrium price then consequently it can be said that

  1. Excess supply exists.
  2. Excess demand exists
  3. Either (1) or (2)
  4. Neither (1) nor (2)

Answer: 2.  Excess demand exists

If the price is below the equilibrium price, supply remains the same, and the demand for the commodity increases.

The long run is the period when both, buyers and sellers get sufficient time to adjust their demand and supply. Hence, both demand and supply can change in the long run

Determination Of Prices Equilibrium Price Supply Remains The Demand

Question 4. An increase in supply with unchanged demand leads to 

  1. Rise in price and fall in quantity
  2. Fall in both price and quantity
  3. Rise in both price and quantity
  4. Fall in price and rise in quantity

Answer: 4. Fall in price and rise in quantity

When there is an increase in supply, demand remains the same, the price of the good decreases, and the quantity demanded increases. It is evident from the following diagram:

Determination Of Prices Quantity Demanded And Supplied

Question 5. In the long run 

  1. Only demand can change
  2. Only supply can change.
  3. Both demand and supply can change
  4. None of these

Answer: 3. Both demand and supply can change

Question 6. The condition for producer equilibrium is 

  1. TR = TVC
  2. MC = MR
  3. TC = TAC
  4. None of these

Answer: 2. MC = MR

Conditions for the producer’s equilibrium are :

  1. MC = MR.
  2. MC should cut MR from below.

Question 7. An increase in supply with demand remaining the same, brings about.

  1. An increase in equilibrium quantity and a decrease in equilibrium price.
  2. An increase in equilibrium price and a decrease in equilibrium quantity.
  3. Decrease in both equilibrium price and quantity.
  4. None of these.

Answer:  1. An increase in equilibrium quantity and a decrease in equilibrium price.

When there is an increase in supply, demand remains the same, the equilibrium price of goods decreases, and the equilibrium quantity increases. It is evident from the following diagram.

Determination Of Prices Equilibrium Price Of Good Decreases And Equlibrium Quantity Increases

Question 8. When the price of a commodity is ₹  20, the quantity demanded is 9 units and when its price is ₹ 19, the Quantity demanded is 10 units. Based on this information, what will be the marginal revenue resulting from an increase in output from 9 units to 10 units?

  1. ₹ 20
  2. ₹ 19
  3. ₹ 19
  4. ₹ 01

Answer: 3. ₹ 19

The marginal revenue resulting from an increase in output from 9 units to 10 units is ₹10

Determination Of Prices Marginal Revenue Resulting From Increases

Marginal Revenue is (190-180) = ₹ 10

Question 9.  From the following table, what will be the equilibrium market price

Determination Of Prices Equilibrium Market Price

  1. ₹ 2
  2. ₹ 3
  3. ₹ 4
  4. ₹  5

Answer: ₹ 3. 4

The equilibrium Market price is ₹ 4 because at this price demand and price are equal so the market price will tend to settle at this figure.

Question 10. If the price of a commodity is fixed, then with every increase in its sold quantity the total revenue will  ___________________ and the marginal revenue will____________________

  1. Increase, also increase
  2. Increase, remain unchanged
  3. Increase, decline
  4. Remain fixed, increase.

Answer: 2. Increase, remain unchanged

If the price of a commodity is fixed, then with every increase in its sold quantity, the total revenue will increase, and the marginal revenue will remain unchanged. Marginal revenue is the change in total revenue. Resulting from the sale of an additional unit of the commodity.

Question 11. If supply decreases and demand remains constant, then equilibrium price will be?

  1. Increases
  2. Decreases
  3. No change
  4. Become Negative

Answer: 1. Increases

When supply falls and demand remains constant, then there will be excess demand in the economy, and to meet the
demand the price of the commodity will rise (Increase).

Question 12. According to Pigou, first-degree price discrimination charges prices to;

  1. Individual capacity
  2. Quantities sold
  3. Location
  4. None of the above

Answer: 1. Individual capacity

Under first-degree price discrimination, the monopolist separates the market into each consumer and charges them the price they are willing and able to pay thereby extracting the entire consumer surplus.

Question 13. What is the shape of the monopolist Average Revenue Curve?

  1. Falls from left to right
  2. Is parallel to X – axis
  3. Is parallel to Y – axis
  4. Rise from left to right

Answer: 1. Falls from left to right

The shape of the monopolist average revenue curve falls from left to right.

Question 14. What is the shape of a perfectly competitive Average Revenue Curve?

  1. Parallel to the X-axis
  2. Parallel to the Y-axis
  3. Fall from left to right
  4. Rise from left to right

Answer: 1. Parallel to the X axis

The curve of average revenue is parallel to X axis as per the perfect competition market.

Determination Of Prices Curve Average Revenue

Question 15. Monopsony means

  1. Where there are large firms
  2. There is a single buyer
  3. A small number of large buyers
  4. Single seller and single buyer

Answer:  2. There is a single buyer

A monopsony is a market condition in which there is only a single buyer – A single buyer dominates the market.

Question 16. When an increase in demand is equal to an increase in supply and the equilibrium price remains constant, then what about equilibrium quantity?

  1. Increases
  2. Decreases
  3. Remains Constant
  4. None of the above

Answer: 1. Increases

In case there is a simultaneous increase in demand as well as supply without a price change, the new equilibrium point will be.  It can be observed that the quantity has moved from Q to Q1, changing the equilibrium point from E to E1 i.e. if the equilibrium price remains unchanged/constant, the equilibrium quantity will increase

Determination Of Prices Quantity Demanded And Supplied

Question 17. An increase in supply with demand remaining the same brings about

  1. An increase in equilibrium quantity and a decrease in equilibrium price.
  2. An increase in equilibrium price and a decrease in equilibrium quantity.
  3. Decrease in both equilibrium price and quantity.
  4. None of these

Answer: 1. An increase in equilibrium quantity and a decrease in equilibrium price.

An increase in supply with demand remaining the same brings about.

Determination Of Prices Supply With Demand Remaning The Same Brings

In the above diagram, we can see that when there is an increase in. Supply curve i.e. from SS’ to S1S1′ where the demand curve remains the same i.e. DD’ with price ‘P’ and quantity ‘Q’.

Then as a result there is an increase in equilibrium quantity i.e., from Q for and price decreases i.e., from P to P1, And the equilibrium point shifted downwards, i.e. from E to E’.

Determination Of Prices Equilibrium Point Shifted Downwards

Question 18. The equilibrium quantity increases, but the charges in the equilibrium price are uncertain when.

  1. Both demand and supply decrease
  2. Demand increases and supply decreases
  3. Both demand and supply increase
  4. Demand decreases and supply increases

Answer:  3. Both demand and supply increase

Two possible outcomes when the supply and demand curve shift in the same direction:

  • When both demand and supply increase, the equilibrium quantity increases, but the change in equilibrium price is uncertain.
  • When both demand & supply decrease, the equilibrium quantity decreases, but the change in equilibrium price is uncertain.

Question 19. When both demand and supply increase, how does it affect the equilibrium quantity and equilibrium price?

  1. The equilibrium quantity increases, but the change in equilibrium price is uncertain.
  2. The equilibrium quantity decreases, but the change in equilibrium price is uncertain.
  3. Equilibrium price increases but the change in equilibrium quantity f is uncertain
  4. Equilibrium price decreases but the change in equilibrium quantity is uncertain.

Answer: 1. When both demand and supply increase. The equilibrium quantity increases, but the change in equilibrium price is uncertain increases but the change in equilibrium price is uncertain.

Question 20. When there is a change in demand and a change in supply, what will be the net influence on price if the change in supply is greater than the change in demand? 

  1. Increase
  2. Decrease
  3. No effect
  4. uncertain change

Answer: 1. Increase

When the supply increases, it results in an excess supply at the earlier equilibrium price. So there will be competition among sellers, which reduces the price. A price fall leads to a rise in demand and a fall in supply.

Question 21. Under which of the following market conditions? both average and marginal revenue are the same?

  1. Perfect competition
  2. Monopolistic competition
  3. Monopoly
  4. Oligopoly

Answer: 1. Perfect competition

Average Revenue = Marginal Revenue = Perfect competition only.

Question 22. ‘Average revenue curve’ is also known as

  1. Production possibility curve
  2. Supply curve
  3. Demand curve
  4. Indifference curve

Answer: 3. Demand curve

Another name for the Average Revenue Curve is the Demand Curve.

Question 23. When demand for a commodity is decreasing as a result of fall in income and its supply remains constant, what will be
impact on its price?

  1. Price increases
  2. Price decreases
  3. No change
  4. Uncertain change

Answer: 2. Price decreases

If supply is constant and demand decreases, the equilibrium price decreases.

Determination Of Prices Demand Decrease Equlibrium Price Decrease

Question 24. In which of the following, prices are determined by market forces of demand and supply? 

  1. Duopoly Competition
  2. Perfect Competition
  3. Monopolistic Competition
  4. Natural Market

Answer: 2. Perfect Competition

Under Perfect Competition, market forces of demand and supply determine the prices and all sellers and buyers individually are price takers.

Question 25. Suppose a seller realizes ₹100 by selling the 10th unit of commodity and. ₹ 120 by selling the 11th unit. What is the MR of, the 11th unit? 1

  1. 100
  2. 120
  3. 20
  4. 10

Answer: 3. 20

MRn = TR11-TR10 .

MR11 = TRn-TRn-1 .

120- 100

= 20

CA Foundation Economics – Theory Of Production Multiple Choice Questions

CA Foundation Economics – Theory Of Production Multiple Choice Questions

Question 1. ______________ shows the overall output generated at a given level of input

  1. Cost function
  2. Production function
  3. ISO cost
  4. Marginal rate of technical substitution,

Answer: 2. Production function

Production function states the relationship between inputs and outputs generated.

Question 2. If the LAC curve falls as output expands, this is due to 

  1. Law of diminishing returns
  2. Economies of scale
  3. Law of variable proportion
  4. Dis-economics of scale

Answer: 2. Economies of scale

In the long run, when output expands total cost first increases, then becomes constant and finally decreases. When output expands, and the cost curve falls it is the first stage of returns to scale which occurs due to economies of scale.

Question 3. Isoquants are equal to:

  1. Product Lines
  2. Total utility lines
  3. Cost lines.
  4. Revenue lines

Answer: 1. Product Lines

An isoquant consists of alternative combinations of input to produce a given quantity of output and product lines are lines representing various combinations of factors of production to produce a given output.

Question 4. The marginal product curve is above the average product curve when the average product is

  1. Increasing
  2. Decreasing
  3. Constant
  4. None

Answer: 1. Increasing

Marginal product and average product are so related. that when the average product increases, MP increases at a faster rate and cuts AP at its Maximum and when AP falls MP falls at a faster rate. So the marginal product curve is above the average product curve when AP is increasing,

Theory Of Production The Marginal Product Cure Above The Average

Question 5. Increasing returns to scale can be explained in terms of:

  1. External and internal economies
  2. External and internal diseconomies
  3. External economics and internal diseconomies
  4. All of these

Answer: 1. External and internal economies

Increasing returns to scale i.e. When output increases more than the increase in input. It occurs due to external and internal economics.

Question 6. An isoquant is to an isocost line at the equilibrium point

  1. Convex
  2. Concave
  3. Tangent
  4. Perpendicular

Answer: 3. Tangent

An isoquant is tangent to an isocost line. This point of tangency defines the equilibrium position of a firm. A higher isoquant shows an unalterable point and a lower one shows underutilised resources. Hence an isoquant with an isocost line as tangent is the equilibrium position.

Question 7. At the point of inflexion, the marginal product is

  1. Increasing
  2. Decreasing
  3. Maximum
  4. Negative

Answer: 3. Maximum

A point of inflexion is a point in the first stage of the law of variable. proportion i.e. When MP becomes maximum. At this point, the slope of TP changes.

Theory Of Production Point Of Inflexion

Question 8. Diminishing marginal returns implies

  1. Decreasing average variable costs
  2. Decreasing marginal costs
  3. Increasing marginal costs
  4. Decreasing average fixed costs

Answer: 3. Increasing marginal costs

Keeping other things constant when marginal cost increases with a considerable increase in variable factors, the marginal product declines. This is the second stage of law of variable proportion or the. stage of diminishing returns.

Question 9. If the marginal product of labour is below the average product of labour, it must be true that

  1. The marginal product of labour is negative.
  2. The marginal product of labour is zero
  3. The average product of labour is falling
  4. The average product of labour is negative

Answer: 3. Average product of labour is falling

Question 10. The law of variable proportion is valid when

  1. Only one input is fixed and all other inputs are kept variable
  2. All factors are kept constant.
  3. All inputs are varied in the same proportion,
  4. None of these

Answer:  1. Only one input is fixed and all other inputs are kept variable

The law of variable proportion occurs in the short- run. Short-run is a period when only one input is fixed and all other inputs are kept variable.

Question 11. Change in total revenue due to incremental change in quantity supplied is called

  1. Marginal Revenue
  2. Marginal Change
  3. Average Revenue
  4. Average Change. 1

Answer: 1. Marginal Revenue

Marginal revenue is defined as an addition made to the total revenue by selling one more unit of a commodity. It is the incremental change in total revenue.

‘ M.R.n = T.R.n-T.R.n-1

Question 12. An increase in all input leading to a less than proportional increase in output is called.

  1. Increasing returns to scale
  2. Decreasing returns to scale.
  3. Constant returns to scale
  4. Both increasing and decreasing returns to scale

Answer: 2. Decreasing returns to scale.

Decreasing returns to scale is the stage when the increase in the output is less than the increase in input, this occurs due to internal and external diseconomies.

Question 13. Consider the following combinations of inputs and outputs

This production technology satisfies:

Theory Of Production Technology Satisfies

  1. Increasing returns to scale
  2. Diminishing returns to scale,
  3. Constant returns to scale
  4. Increasing returns initially, followed by decreasing returns to scale.

Answer: 3. Constant returns to scale

In the given production technology the increase in input is proportionate to the increase in output. With an increase of every 1 unit of labour and 2 units of capital the output increases by 1 unit. Hence, it is the case of constant returns to scale as both fixed and variable factors are changing (all factors are variable).

Question 14. During the stage of the law of diminishing returns

  1. MP and TP is the maximum
  2. MP and AP are decreasing
  3. AP is negative
  4. TP is negative

Answer: 2. MP and AP are decreasing

During the second stage of the Law of Diminishing Returns (i.e. Law of Variable Proportion) both MP and AP are decreasing because at this stage the optimum combination between fixed and variable factors has been attained and now if the input is increased, the output starts decreasing. At this stage, total product increases at a diminishing rate i.e. MP and AP decreases.

Question 15. Consider the following table:

Theory Of Production Labour And Total Product And Marginal Product

What is the total output, when 2 labourers are employed?

  1. 80
  2. 100
  3. 180
  4. 200

Answer: 3. 180

When 1 unit of labour is employed TP = 100, MP = 100 when the 2nd unit of labour is employed MP = 80 i.e. addition made to the total product is 80.

The total product when 2 labourers are employed is 100 + 80 = 180.

Or

MP2 =TP2 – T.P2-1

80 =TP2-100.

TP2 = 80+100

=180.

Question 16. Who has given the concept of Innovative Entrepreneurship?

  1. Robbins
  2. Adam Smith
  3. Schumpeter
  4. Sweezy

Answer: 3. Schumpeter

The concept of Innovative Entrepreneurship was given by Schumpeter.

Question 17. AT 10 units Total Cost → ₹ 200 , 20 units Total Cost →  ₹ 600

Marginal Cost =?

  1. 50
  2. 40
  3. 30
  4. 400

Answer: 2. 40

Given Original total cost = ₹ 200

Original quantity produced = 10 units New total cost = ₹ 600

New quantity produced = 20 2units

Marginal coot h the addition made to the total cost by the production of an additional unit of output

Additional Coot = ₹ 600 – ₹ 200

= ₹ 400

Additional quantity produced = 20 units -10 units

= 10 units

∴ M. C = ½

= ₹ 40

Question 18. Average Fixed Cost – ₹ 20, Quantity Produced = 10 units. What will be the Average Fixed Cost of 20th  units?

  1. ₹ 10
  2. ₹ 20
  3. ₹ 5
  4. None

Answer: 1. ₹ 10

Average fixed cost (AFC) is the total fixed cost divided by the number of units produced i.e. AFC = TFC/Q

Whore Q is the number of units produced

TFC = ₹ 20 × 10 units

= ₹ 200

Q = 10 units

AFC = \(\frac{200}{20}\)

= ₹ 10

Since AFC steadily falls as output increases hence for the 20th unit AFC is ₹ 10

Question 19. What Is Production in Economics

  1. Croation / Addition of Utility
  2. Production of food grains
  3. Creation of services
  4. Manufacturing of goods

Answer: 1. Croation / Addition of Utility

In Economics, production is the process by which man utilizes or converts the resources of nature, v/orks upon them to make them satisfy human wants. The satisfying power of goods and services is called utility. Hence we can conclude that production can also be defined as the creation or addition of utility.

Question 20. External Economies of Scale are obtained by

  1. A firm
  2. A group of firm
  3. Small Production
  4. Society

Answer: 2. A group of firm

External Economies of scale accrue to firms as a result of expansion in the output of the whole industry and they are not dependant on the output level of individual firms. They are external in the sense that they accrue to firms not because of their internal situation but from outside i.e, expansion of the industry.

Question 21. If a firm’s output is zero, then

  1. AFC will be positive
  2. AVC will be zero
  3. Both of (1) and(2)
  4. None of (1) and (2)

Answer:  3. Both of (1) and(2)

Average fixed cost may be expressed as Fixed cost divided by the number of units. When the firm’s output is zero, the average fixed cost is positive as fixed cost is incurred even if no units are produced. Average variable cost may be expressed as variable cost per unit produced. When the firm’s output is zero, there will be no variable cost hence average variable cost will be zero.

 Question 22. The functions of the entrepreneur are

  1. Risk bearing
  2. Initiating a business enterprise and resource co-ordinating
  3. Introducing innovations
  4. All of the above

Answer: 4. Initiating a business enterprise and resource co-ordinating

The entrepreneur has also been called the organiser, the manager or risk- the taker. The task of an entrepreneur Is to initiate production work and to bear the risks Involved.

An entrepreneur performs the following functions:

  1. Initiating a business enterprise and resource coordination
  2. Risk-bearing or uncertainty-bearing
  3. Innovation

Question 23. The law of diminishing returns is applicable in

  1. Manufacturing industry
  2. Agriculture
  3. Neither (1) nor (2)
  4. Any economic activity at a point in time

Answer: 4. Any economic activity at a point in time

The law of diminishing returns states that as more and more factors of production are employed, the total production first increases, and then eventually declines. This law applies to all economic activities at some point or the other.

Question 24. The labour force wants more.

  1. Facility
  2. Leisure
  3. Benefit all of the above

Answer: 2. Leisure

Labour is one of the factors of production. A labourer has to choose between hours of labour and hours of leisure. The labour force prefers to have more of rest and leisure than earning money.

Question 25. Production activity in the short run is analysed by

  1. Returns to scale
  2. Economies of scale
  3. Law of variable proportion
  4. None of these

Answer: 3. Law of variable proportion

Short-run is a period when only one factor is fixed and the rest are variable. The law of variable proportion operates in the short run. Therefore, in the short- run production activity is analysed by this law.

Question 26. Increasing returns to scale occur due to

  1. Economies of scale
  2. Specialization
  3. Indivisibility of factors
  4. All of these

Answer: 4. All of these

Increasing returns to scale occurs when the output increases more than the increase in input. This occurs due to economies of scale it occurs due to the indivisibility of factors and returns to scale may also increase because of greater possibilities of specialization of land and machinery.

Question 27. The law of diminishing returns is applicable in______________________

  1. Only manufacturing industries
  2. Only agriculture
  3. Neither in agriculture nor in industries
  4. In all economic activities after a limit

Answer: 4. In all economic activities after a limit

The law of diminishing returns states that as more and more factors of production are employed, the total product first increases and then eventually declines. This law applies to all economic activities after a limit.

Question 28. The law of increasing returns is applicable because of ___________________

  1. Indivisibility of factors
  2. Specialization
  3. Economies of scale
  4. Both (1) & (2) above

Answer:

  1. The two causes of the Law of Increasing Returns are:
  2. Indivisibility of Factors.
  3. Division of Labour and specialization.
  4. Hence both options A and B are correct.

Question 29. When output decreases by 20% due to an increase in inputs,

  1. This stage is called the law of
  2. Increasing returns to scale decreasing returns to scale
  3. Constant returns to scale
  4. None of the above

Answer: 4. None of the above

The law of constant returns states that with an increase in input, the output also increases in the same proportion. However, in the given question, the output is decreasing by 20% due to an increase in input. This is not the case with constant returns to scale. This is neither the case of increasing returns to scale nor decreasing returns to scale, hence, the answer would be none of the above.

Question 30. In the first stage of the law of variable proportions, the total product increases at the _____________________________

  1. Decreasing rate
  2. Increasing rate
  3. Constant rate
  4. Both 1 and 2.

Answer: 2. Increasing rate

The law of variable proportion states that as we increase the quantity of one input which is combined with other fixed inputs, the MP of variable input eventually declines.

It is divided into three stages (laws):

  1. Law of increasing returns
  2. Law of decreasing returns
  3. Law of negative returns

Question 31. What will be the total product when two labourers are hired according to the table given below?

No. of labourers Total product Marginal product

Theory Of Production Labourers And Marginal Product

  1. 680
  2. 580
  3. 350
  4. 230

Answer: 2. 580

TPn = TPn-1 + MPn

= 350 + 230

= 580

Question 32. Which function shows the relationship between input and output?

  1. Consumption function
  2. Investment function
  3. Production function
  4. Cost function

Answer: 3. Production function

Production function states the relationship between inputs and output i.e. the maximum amount of output that can be produced with given quantities of inputs under a given state of technical knowledge.

Question 33. External economies are enjoyed:

  1. Large producers only
  2. As the firm expands
  3. Both (1) and (2)
  4. None of the above.

Answer: 3. Both (1) and (2)

External economies are those economies which accrue to firms as . a result of expansion in the output of the whole industry and they are not dependent on the output level of individual firms. Externa! economies are enjoyed by large producers.

Question 34. The Law of Diminishing Returns is applicable in

  1. Only in manufacturing industries
  2. Only in agriculture
  3. Neither in agriculture nor in industries
  4. All economic activities after a point.

Answer: 4. All economic activities after a point.

The law of diminishing returns occurs in the short run and states that as more and more units of variable factors are employed to a fixed factor total product first Increases and then eventually declines.

This law occurs in all economic activities after a point of time because after reaching an optimum combination the factors become over-utilized and lead to lesser production.

Question 35. The concept of Returns to Scale is related to

  1. Very short period
  2. Short period
  3. Long period
  4. None of the above.

Answer: 3. Long period

Long-run. refers to the period when all the factors change and no factor is fixed. When all inputs are changed in the same proportion, it leads to a change in scale. Therefore, returns to scale occur in the long run.

Question 36. The function of an entrepreneur is:

  1. Initiating an enterprise and resource coordination
  2. Risk bearing
  3. Introducing innovations
  4. All of the above.

Answer: 4. All of the above.

An entrepreneur is a person who combines all factors of production, bears risk and initiates the process of production.

An entrepreneur performs the following functions:

  • Initiating a business and resource coordination:
  • Risk-bearing and uncertainty-bearing
  • Taking innovations

Question 37. Which of the following is not a characteristic of land?

  1. It is a gift of nature
  2. It is a mobile factor of production
  3. It is limited in quantity
  4. Its productive power is indestructible.

Answer: 2. It is a mobile factor of production

A factor of production should have the following characteristics to be called land :

  1. It is a gift of nature
  2. It is strictly limited in quantity
  3. It is indestructible
  4. It cannot be shifted from one place to another.
  5.  It is a specific factor of production

Question 38. A production function is defined as the relationship between

  1. The quantity of physical inputs and physical output of a firm
  2. Stock of inputs and stock of output
  3. Prices of inputs and output
  4. Price and supply of a firm.

Answer: 1. The quantity of physical inputs and physical output of a firm

Production function states the relationship between inputs and output i.e. the maximum amount of output that can be produced with given quantities of inputs under a given state of technical knowledge.

Question 39. Production activity in the short period is analysed with the help of

  1. Law of variable proportion
  2. Laws of returns to scale
  3. Both (1) & (2)
  4. None of the above.

Answer: 1. Law of variable proportion Laws of returns to scale

Production function states the relationship between inputs and outputs. The production activity can be in the short run or long-run. A short period is a period which is too short for a firm to install new capital equipment to increase production. This is done when the law of variable proportion is analysed

Question 40. Which of the following is the reason for the working of the law of increasing returns?

  1. Fuller utilisation of fixed
  2. FactorsIndivisibility of the factors
  3. Greater specialization of labour
  4. All of the above.

Answer: 4. All of the above.

The causes of the law of increasing returns are:

  • Indivisibility of factors.
  • Division of labour and specialisation.
  • When a variable factor is increased, fuller utilisation of the fixed factor becomes possible and it results in increasing returns.
  • Hence, all of the above are the reasons for working on the law of increasing returns.

Question 41. External economies can be achieved through

  1. Foreign trade only
  2. Superior managerial skill
  3. Extension of transport and credit facilities
  4. External assistance.

Answer: 3. Extension of transport and credit facilities

External economies of scale are those which accrue to firms as a result of expansion in the output of the whole industry.

These are available to one or more of the firms in the form of:

  • Cheaper raw materials and capital equipment
  • Technological external economies
  • Development of skilled labour
  • Growth of ancillary industries

Better transportation and marketing facilities. Thus, external economies can be achieved through the extension of transport and credit facilities

Question 42. External economies arise due to

  1. Growth of ancillary industries
  2. High cost of technologies
  3. Increase in the price of factors of production
  4. None of the above.

Answer: 1. Growth of ancillary industries

External economies arise due to the following reasons:

  1. Cheaper raw materials and capital equipment
  2. Technological external economies
  3. Development of skilled labour
  4. Growth of ancillary industries
  5. Better transportation and marketing facilities

Question 43. Innovation theory of entrepreneurship is propounded by

  1. Knight
  2. Schumpeter
  3. Max Weber
  4. Peter Drucker

Answer: 2. Schumpeter

The concept of innovative entrepreneurship was propounded by Schumpeter.

Question 44. Production function is

  1. Purely technical relationship between input & output
  2. Purely an economic relationship between input & output
  3. Both the technical & economic relationship between input & output
  4. None of the above.

Answer:  1. Purely a technical relationship between input & output

Production function states the relationship between inputs and the output i.e. the maximum amount of the output that can be produced with the given quantities of inputs under a given state of technical knowledge. ,

Thus, the production function is purely a technical relationship between input & output.

Question 45. The concept of returns to scale is related with

  1. Very short period
  2. Short period
  3. Long period
  4. None of the above

Answer: 3. Long period

Long-run refers to the period when all the factors change and. no factor is fixed, when all inputs are changed in the same proportion, it leads to a change in scale. Therefore, returns to scale occur in the long run.

Question 46. In the Cobb-Douglas production function, two inputs are

  1. Land and Labour
  2. Labour and Capital
  3. Capital and Entrepreneur
  4. Entrepreneur and land

Answer: 2. Labour and Capital

Cobb-Douglas Production function applies not to an individual firm but to the whole of manufacturing. In this case, output is manufacturing production and inputs used are labour and capital.

Question 47. Which one of the following is not a characteristic of land?

  1. A gift of nature
  2. Its supply is fixed
  3. An active factor of production
  4. It has different uses.

Answer: 3. An active factor of production

As a theoretical concept, land has the following characteristics:

  • Land is Nature’s gift.
  • The supply of land is fixed.
  • It has indestructible powers.
  • It is a passive factor.
  • It has different uses.

Hence, land is not an active factor of production, the option is the correct answer

Question 48. An Entrepreneur undertakes which one of the following functions?

  1. Initiating a business and resource coordination
  2. Risk or uncertainty-bearing
  3. Innovations
  4. All of the above.

Answer: 4. All of the above.

An entrepreneur performs the following functions in general:

  •  Initiating a business enterprise & resource coordination.
  •  Risk bearing/uncertainty bearing.
  •  Innovations. .

‘ Hence, option i.e. all of the above is the correct answer.

Question 49. To increase its production, Hariharan a manufacturer of shoes, increases. all the factors of production in his unit by 100%. But at the end of the year, he finds that instead of an increase of 100%, his production has increased by only 80%. Which law of returns to scale is operating in this case?

  1. Increasing returns to scale
  2. Decreasing returns to scale
  3. Constant returns to scale
  4. None of the above.

Answer: 2.  Decreasing returns to scale

When output increases in a smaller proportion with an increase in all inputs, decreasing returns to scale are said to prevail. In this case, inputs are increased by 100% in comparison to outputs which are increased by 80%.

Question 50. The linear homogeneous production function is based on

  1. Increasing returns to scale
  2. Decreasing returns to scale
  3. Constant returns to scale
  4. None of the above

Answer:  3. Constant returns to scale

Question 51. Which of the following statements is true about an ISO-Quant Curve?

  1. It represents those combinations of two factors of production that will give the same level of output
  2. It represents those combinations of all the factors that will give the same level of output
  3. It slopes upward to the right
  4. It can touch either axis.

Answer:  1. It represents those combinations of two factors of production that will give the same level of output

An ISO-quant represents all those combinations of two factors of production which are capable of producing the same level of output.

Question 52. Production is defined as:

  1. Creation of matter
  2. Creation of utility in matter
  3. Creation of infrastructural facilities
  4. None of the above.

Answer:  2. Creation of utility in matter

By production we mean the process by which man utilises or converts the resources of nature, working upon them to make them satisfy human
wants.

Question 53. The long-period production function is related to

  1. Laws of variable proportions
  2. Laws of returns to scale
  3. Laws of diminishing returns
  4. None of the above.

Answer: 2. Laws of returns to scale

Long period production function is related to the law of returns to scale which relates to the long-period production function by changing one or more of its factors. The long-period production function is related to laws of returns to scale v/hich relates to the long-period production function by changing one or more of its factors.

Question 54. The conclusion drawn from the Cobb-Douglas production function is that labour contributed about and capital about of the increase in the manufacturing production.

  1. (¾) th ,(¼)th
  2. ½, ½
  3. (¼)th, (¾) th
  4. None of the above.

Answer: 1. (¾) th ,(¼)th

Cobb-Douglas production function states that labour contributed about  and capital about (¾) th th of the increase in the (¼)th manufacturing production Q = KLaC (1-a)

Where ‘Q’ is output, ‘L’ is the quantity of labour, ‘C’ is the quantity of capital, ‘K’ and ‘a’ are positive constants.

Question 55. ISO quants are also known as

  1. Production possibility curves
  2. Indifference curves
  3. Production indifference curves
  4. None of the above.

Answer: 3. Indifference curves

ISO quants are also known as production indifference curves. They show all those combinations of different factors of production which give the same output to the producer. ISO quants are similar to indifference curves of the theory of consumer behaviour.

Question 56. Human capital refers to

  1. Savings by individuals
  2. Mobilisation of savings
  3. Human skills and abilities
  4. Productive investment.

Answer: 3. Mobilisation of savings

Human capital refers to human skill and ability. This is called human capital because a good deal of investment has gone into the creation of these human abilities.

Question 57. The Law of Variable Proportions is associated with

  1. Short period
  2. Long period
  3. Both short and long periods
  4. Neither short nor long period.

Answer: 1. Short period

The law of variable proportions examines the production function with one-factor variable, keeping quantities of other factors fixed. This law operates in the short run when all the factors of production cannot be increased or decreased simultaneously. In other words, it refers to the input-output relationship.

Question 58. Which one of the following statements is not correct?

  1. The land has indestructible powers
  2. Labour is mobile
  3. Capital is nature’s gift
  4. Land is a passive factor.

Answer: 3. Capital is nature’s gift

Capital has been rightly defined as ‘produced means of production’. If has been produced by man by working with nature. Therefore, capital may well be defined as man-made instruments. of

Question 59. Which of the following is not a characteristic of labour?

  1. It is perishable
  2. It has weak bargaining power
  3. Labour and Labour power cannot be separated
  4. Labour is not mobile

Answer:  4. Labour and Labour power cannot be separated

Labour is not mobile. This is not a characteristic of labour. Labour is mobile.

Question 60. Which among the following is not a characteristic of Land?

  1. It is an active factor
  2. It has a variety of uses
  3. Its production powers are indestructible
  4. Its supply is limited

Answer: 1. It is an active factor

Land is a passive factor of production. It is not an active factor.

Question 61. When the average product rises as a result of an increase in the quantity of variable factor, the marginal product is

  1. Equal to the average product
  2. More than average product
  3. Less than average product
  4. Becomes negative

Answer: 2. More than average product

When the average product rises as a result of an increase in the quantity of variable factors, marginal product is more than the average product.

Question 62. Suppose the first four units of a variable input generate a corresponding total output of 150,200, 350, 550. What will be the marginal product of the third unit of input?

  1. 50
  2. 100
  3. 150
  4. 200

Answer: 3. 150

The marginal product of the third unit of input = TP3-TP2

= 350 – 250

= 150

Question 63. The famous Cobb-Douglas production function is based on studies of _____________ industries in the United States of America.

  1. Manufacturing
  2. Construction
  3. Consumer
  4. Aviation

Answer: 1. Manufacturing

A famous statistical production function is the Cobb-Douglas production function. Paul H. Douglas and C.W. Cobb of the U.S.A. Studied the production function of the American manufacturing industries. In its original form, this production function applies not to an individual firm but to the whole of manufacturing in the United States.

Question 64. In Economics, the entire process of __________________________ utilities in the form of goods and services.

  1. Consumption
  2. Production
  3. Exchange
  4. Distribution

Answer: 2. Production

Production is nothing but the creation of utilities in the form of goods and services. For example, in the production of a woollen suit, utility is created in some form or the other. Firstly wool is changed into woolen cloth at the spinning and weaving mill (utility created by changing the form) then it is taken to a place where it is to be sold (utility added by transporting it).

Since woollen clothes are used only in winter, it will be retained until such time when then they are required by purchasers(time utility). In the whole process, services of various groups of people are utilized (as that of mil

Question 65. Cobb Douglas function is given by Q = KLa Ca

  1. If α + β > 1, increasing returns
  2. If α + β > 1, increasing returns to scale
  3. If α + β < 1, diminishing returns
  4. If α + β = 1, decreasing returns to scale.

Answer: 2. If α + β > 1, increasing returns to scale

The cobb-Douglas function is given by Paul H. Douglas and C.W. Cobb of the U.S.A. studied the production of American Manufacturing industries. They describe that output is manufacturing and input is labour and capital. It is given by Q = K La C(1-a) if, a + b > 1, increasing the return to scale.

Question 66. Production is defined as

  1. Creation of matter
  2. Creation of utility in matter
  3. Creation of infrastructural facilities
  4. None of the above.

Answer: 2. Creation of utility in matter

Man cannot create matter. Man can create only utility in matter. Production should not be taken as the creation of matter but it is taken as the creation of utility in matter.

For Example: When a man produces a table, he does not create the matter of which the wood is composed of. He only transforms wood into chairs and utility to wood which did not have utility before workers, shopkeepers, agents etc.) to contribute to the enhancement of utility. Thus, the entire process of production is nothing but creation of form utility, place utility, time utility and/or personal utility

Question 67. The conclusion drawn from Cobb Douglas’s production function is that labour contributed about and capital to the increase in manufacturing production.

  1. (¾)th, (¼)th
  2. (½)th, (½)th’
  3. (¼)th, (¾)th,’
  4. None of the above

Answer: 1. (¾)th, (¼)th

As Cobb-Douglas function is below:

Q = K La C(1-a)

This shows that labour produces ¾ th  and capital produces ¼  of the increase in manufacturing production

Question 68. At the point of inflexion, the marginal product is

  1. Increasing
  2. Decreasing
  3. Maximum
  4. Negative

Answer: 3. Maximum

A point of inflexion is a point where the marginal product is at maximum. First marginal product utility increase then reaches at maximum points which is the point of inflexion and then decreases. Marginal product can be negative.

Question 69. Isoquants are equal to

  1. Product lines
  2. Total utility lines
  3. Cost lines
  4. Revenue lines

Answer: 1. Product lines

Isoquants are similar to indifference curves of the theory of consumer behaviour. An isoquant represents all those combinations which are capable of producing the same level of output. The production indifference curve is another. Name of isoquants as it represents product lines.

Question 70. Increasing returns to scale can be explained in terms of

  1. External and internal economics
  2. External and internal diseconomies
  3. External economies and internal diseconomies
  4. All of these

Answer: 1. External and internal economics

An increasing return to scale means an increase in output is greater than the increase in input and an increasing return to scale caused due to external and internal economies while a decreasing return to scale is caused due to external and internal diseconomies.

According to Cobb- the production function is stated as Q = KLa C(1-a)

When ‘Q’ is output, ‘L’ is the quantity of labour and ‘C’ is the quantity of capital. ‘K’ and ‘a’ are positive constants.

Question 71. Which of the following statements about factors of production is not true

  1. Land is a passive factor
  2. The land is a gift of nature
  3. Land is immobile
  4. Land is perishable

Answer: 4. Land is immobile

Characteristics of land are:

  • The land is a gift of nature
  • The supply of land is fixed
  • The land is permanent and has indestructible power
  • Passive factor
  • Land in Immobile.

Therefore, land is not perishable and option will be the answer.

Question 72. Which of the following is considered as production in economics?

  1. Helping a blind person crossing the road
  2. Group dance performance in a college’s annual function
  3. Holding a child who is falling from a wall
  4. Performing art in a theatre

Answer: 4. Performing an art in a theatre

Production consists of various processes to add utility to natural resources for gain greater satisfaction from them by making use of personal skills in the form of services.

Example: Performing an art in a theatre.

Question 73. The marginal, average and total product of a firm in the short run will not comprise with

  • When marginal product is at a maximum, average product is equal to marginal product, and total product is rising
  • When an average product is maximum, the average product is equal to the marginal product, and the total product is rising
  • When the marginal product is negative, total product and average product falling
  • When total product is increasing, average product and marginal product may be either rising or falling

Answer: 1. When marginal product is at a maximum, average product is equal to marginal product, and total product is rising

The relationship between the average product and the marginal product is as follows:

  • When the average product rises, the marginal product is more than the average product
  • When an average product is maximum, MP = AP
  • When the average product falls, the marginal product is less than the average product.
  • Hence, option (1) is not the relation between MP and AP.

Question 74. Supply of land ___________ in case of economy?

  1. Elastic
  2. Inelastic
  3. Perfectly elastic
  4. Perfectly inelastic

Answer: 4. Perfectly inelastic

The supply of land is perfectly inelastic in the case of the economy. Land is v strictly limited in quantity. It is different from other factors of production in that no change in demand can affect the amount of land in existence. However, it is relatively elastic from the point of view of a firm.

Question 75. MP is the slope of

  1. TP
  2. AP
  3. Both
  4. None

Answer: 1. TP

Marginal Product is the slope of Total Product as the total product is the total output resulting from the efforts of all factors of production combined together at any time. Marginal product is the change in total product per unit change in the quantity of variable factor, i.e. it is the addition made in additional unit of output.

MPn= TPn -Tn-1

Or ΔTP/ΔQ  = ΔTP

ΔQ = Change in Quality

For Questions (76 to 78) use the data table given below:

Theory Of Production Data Table

Question 76. What will be the total output for 2 workers?

  1. 6
  2. 18
  3. 12
  4. 17

Answer: 2. 18

Question 77. What will be the marginal output for 3 workers?

  1. 6
  2. 12
  3. 7
  4. 8

Answer: 1. 6

Question 78. Average Product for three labour

  1. 12
  2. 11
  3. 8
  4. None

Answer: 3.8

For Answers (76 to 78) use the data table given below:

At the first unit of output. Total output and Marginal output are equal i.e.

TP = MP = 10 units (given as TP = 10)

TP = ∑MP

∴ TP = 10 + 8 = 18 units of output

As Mpn = TPn = TPn-1

i.e. TPn = TP3 i.e.

∴ Total product at 3 units of labour (worker)

TPn-1 = TP3-1 = TPn-2

∴ Total product at 2 units of labour (worker)

MPn = MP3 =  i.e. marginal product at 3 units of labour (worker)

24 units- 18 units = 6 units.

And marginal product is Maximum at 8 units of labour.

Theory Of Production Data Table .

Question 79. The concept of innovative entrepreneurship was given by

  1. Marshall
  2. Schumpeter
  3. J. K. Mehta
  4. Adam Smith

Answer: 2. Schumpeter

The concept of innovative entrepreneurship was propounded by Schumpeter.

Question 80. Which activity is the best of nil tho production activities

  1. Production
  2. Exchange
  3. Investment
  4. Consumption

Answer: 3. Investment

Investment is the base for all production.

Question 81. When output increases more than the increase in input it occurs due to 

  1. External and internal diseconomies
  2. External and internal economies
  3. External diseconomies and internal diseconomies
  4. External economies and internal economies

Answer: 2. External and internal economies

Internal economies of scale are firm-specific, while external economies of scale occur based on larger changes and costs down while increasing the volume of output.

Question 82. A functional relationship between inputs and output is called

  1. Cost function
  2. Revenue function
  3. Consumption
  4. Production function

Answer: 4. Production function

The production function is a technical relationship between the amount of inputs that a firm uses and the maximum level of output that can be obtained.

Question 83. Among the following statements which is incorrect about isoquants

  1. Isoquants are negatively sloped
  2. Isoquants are convex to the origin
  3. Isoquants are not intersecting
  4. Isoquants are concave to origin

Answer: 2. Isoquants are convex to the origin

Isoquants are convex to the origin:

Like indifference curves, isoquants are convex to the origin. To understand this fact, we have to understand the concept of diminishing marginal rate of technical substitution (MRTS), because the convexity of on isoquant implies that the MRTS diminishes along the isoquants.

Question 84. External economies can be achieved through

  1. Technological external economies
  2. External assistance
  3. Development of unskilled labour
  4. Superior managerial efficiency

Answer: 1. Technological external economies

External Economies can be achieved through all external sources like technology etc. Un-skilled labour development and superior managerial efficiency are internal economies.

Question 85. Marginal product will be at the point of inflexion is

  1. Maximum
  2. Minimum
  3. Negative
  4. Zero

Answer: 1. Maximum

At the point of inflexion, the marginal product is maximum up to the point of inflexion. TP has been increasing at an increasing rate resulting in  increasing MP

Question 86. Production may be defined as an act of

  1. Creating utility
  2. Destroying utility
  3. Earning profit in the best way
  4. Providing services professionally

Answer: 1. Creating utility

Production may be defined as the act of creating utility. Production may be defined as an act of making goods and thus adding utility to the object.

Question 87. Which of the following is correct about Marginal Product?

  1. What are produced units when all factors of production are employed at optimum efficiency?
  2. The extra output obtained from employing an additional unit of a factor
  3. The left revenue to the entrepreneur after he has incurred all expenses
  4. None of the above.

Answer: 2. The left revenue to the entrepreneur after he has incurred all expenses

The extra output obtained from employing an additional utility of a factor

Marginal product refers to the addition to the total product When an additional unit of a commodity is employed and thus produced.

MP =TPA-Tpn-1

Question 88. According to Cobb-Douglas production function, labour contribution in increasing manufacturing production is

  1. 2/3
  2. 3/4
  3. 1/4
  4. 1/2

Answer: 2. 3/4

Cobb – Douglas production function, labour contribution is increasing manufacturing production is 3/4

Question 89. When the Average Product falls, the marginal product is the Average product.

  1. Less than
  2. More than
  3. Equal to
  4. Maximum

Answer: 1. Less than

When Average Product falls marginal product is less than the average product.

Theory Of Production The Marginal Product Is Less Than The Average Product

Question 90. How many kinds are Economics of scale

  1. 5
  2. 3
  3. 2
  4. 1

Answer: 3. 2

There are two types of Economies of scale

Theory Of Production Economies Of Scale

Question 91. In the short run, the Law of variable proportions is also known as

  1. Law of increasing returns
  2. Law of diminishing returns
  3. Law of decreasing returns
  4. Law of constant returns

Answer: 2. Law of diminishing returns

In the short run, the law of variable proportion is known as the law of diminishing returns.

Question 92. The Law of returns to scale is.

  1. Short run
  2. Long run
  3. Short and Long run
  4. Medium run

Answer: 2. Long run

The laws of return to scale is applicable in the long run only.

Question 93. Which of the following is not a passive factor of production?

  1. Land
  2. Building
  3. Labour
  4. Machine

Answer: 3. Labour

Labour is not a passive factor of production i.e. Labour is an active factor, without the active participation of labour, land and capital may not produce anything.

Question 94. Which one of the following is not a necessary function of an entrepreneur?

  1. Risk and uncertainty-bearing
  2. Initiating a business enterprise
  3. Innovations
  4. Suspension of day-to-day production activities.

Answer: 4. Suspension of day-to-day production activities.

  • The functions of an entrepreneur are:
  • Initiating business enterprise
  • Risk-bearing and uncertainty-bearing

Question 95. The land is heterogeneous because of

  1. Lands are alike
  2. Lands are not alike
  3. Lands are fixed
  4. Lands are mobile

Answer: 2. Lands are not alike

The land is heterogeneous because no two lands are alike they differ in size, fertility and situation.

Land is a gift of nature, fixed in supply, passive, and immobile.

Question 96. When TP is decreasing, MP becomes?

  1. Positive
  2. Zero
  3. Undefined
  4. Negative.

Answer: 4. Negative

When TP is increasing, MP is increasing, MP is zero, TP is maximum, when MP is negative and average revenue is diminishing, TP is decreasing/diminishing.

Question 97. Profit is an income from

  1. Land
  2. Investment
  3. Business
  4. Labour

Answer: 3. Business

Profit is an income from business.

Profit is the revenue that remains after expenses in a business. The main aim of business is the acquisition of profits.

Question 98. If the output has to max then

  1. MR < MC
  2. MR = MC
  3. MR > MC
  4. None of the above

Answer: 2. MR = MC

If the output is to be maximum level then the Marginal Revenue should be equal Marginal Cost.

When MR, MC, a firm has maximum output produced with additional products/outputs for maximum revenue.

Question 99. Marginal Cost changes due to changes in cost

  1. Total
  2. Fixed
  3. Average
  4. Variable

Answer: 4. Variable

Marginal cost is the addition made to the total cost by the production of an additional unit of output. It is independent of fixed cost. It is only the variable cost which changes with a change in the level of output in the short run.

Question 100. Which cost increases continuously with the increase in production?

  1. Fixed cost
  2. Variable cost
  3. Total cost
  4. Average cost

Answer: 2. Variable cost

Variable cost increases as production increases as every additional unit of output increases the variable cost. Find cost remains the same.

Question 101. The market where small quantities of goods are sold-

  1. Wholesale
  2. Retail
  3. Manufacturers
  4. None of the above

Answer: 2. Retail

The market where small quantities of goods sold are Retail

Question 102. The Law of variable proportion Is associated with.

  1. Short period
  2. Long period
  3. Both short & long periods
  4. Neither short nor long-period

Answer: 1. Short period

The law of variable proportion Applies to short-run periods. The law of variable proportion exhibits the relationship between the change of output In respect do tho change in only one variable factor, only In the short-run economy.

Question 103. Producer’s surplus arises when

  1. The price of the commodity is more than tho minimum price at which the producer is willing to supply.
  2. The price of the commodity is less than the minimum price at which the producer is willing to supply.
  3. The price of the commodity is equal to the minimum price the, producer is willing to supply at.
  4. The price of the commodity is zero to the maximum price the producer is willing to supply at.

Answer: 1. The price of the commodity is more than the minimum price at which the producer is willing to supply.

A producer surplus is generated by market prices more than the lowest price producers would otherwise be willing to accept for their goods.

Question 104. The scale of production can be changed in

  1. Short period
  2. Very short period
  3. Long period
  4. Both short and very short period

Answer: 3. Long period

Since all the factors are only variable in the long run, the scale of production is only changed in the long run, thus, the law of returns to scale will only apply in the long run.

Question 105. Which of the following is not a quality of the factor of land

  1. Passive factor
  2. Active factor
  3. Heterogeneous
  4. Trimobile

Answer: 2. Active factor

The land is not an active factor unless human effort is exercised on land, it does not produce anything on its own.

Question 106. The concept of “Innovative Entrepreneurship” was propounded by

  1. Joel Dean
  2. Schumpeter
  3. Marshall
  4. Karl Marx

Answer: 2. Schumpeter

According to Schumpeter, the true function of an entrepreneur is to introduce innovations.

Question 107. Returns to scale occur in

  1. Small run
  2. Long run
  3. Very-small run
  4. Undetermined

Answer: 2. Long run

Returns to scale (i.e. all factors are variable) occur due to long-run

Question 108. Which one of the following is not a characteristic of land?

  1. Land is immobile
  2. Land is an active factor
  3. The land has multiple uses.
  4. Land is heterogeneous

Answer: 2. Land is an Active factor

Land is a passive factor of production not an active factor of production. like labour. Unless human efforts are involved land cannot produce anything on its own.

Question 109. When TP is decreasing, MP becomes

  1. Zero
  2. Negative
  3. Positive
  4. Infinite

Answer: 2. Negative

At the stage of Negative Returns, the total product declines, MP becomes negative and the average product starts diminishing.

Question 110. Technical relationship between inputs and output: 

  1. Production function
  2. Supply function
  3. Marketing function
  4. Social function

Answer: 1. Production function

Production function states the technological relationship between inputs and outputs that results from the use of a firm’s scarce resources.

Question 111. The stage of “Decreasing Returns to Scale” will occur, when

  1. A decrease in output is greater than the increase in input
  2. A decrease in output is greater than the increase in input
  3. An increase in output is greater than the increase in input
  4. An increase in output is less than the increase in input

Answer: 4. Increase in output is less than the increase in input

If the increase in output is less than an increase in input it is called decreasing returns to scale.

CA Foundation Economics – Theory Of Demand And Supply

Law Of Demand And Elasticity Of Demand

Demand

The desire to have a commodity backed by purchasing power at a particular price in a particular period is known as Demand.

Demand. per commodity refers to the amount of the commodity that consumers are willing and able to purchase at a particular price in a particular period/-

Types of Demand:

  1.  Individual and Market Demand: –
    • The quantity of a commodity that .an individual consumer is willing to purchase at a given price during a given period is known as Individual demand.
    • The total quantity of a commodity that all the consumers are willing to buy at a given price during a given period.
  2. Ex-ante and Ex-post Demand:
    • Ex-ante demand refers to the amount of goods the consumers want/are willing/plan to buy during a particular period.
    • Ex-post demand refers to the amount of goods that consumers purchase during a specified period.
    • Ex-ante demand can be less more or equal to ex-post demand.
  3. Joint Demand:
    • It refers to the demand for two or more goods that are used jointly or demandedtogether.
    • Example: Car and petrol pen and ink mobile and SIM card.
  4. Derived Demand:
    • The demand for a commodity arises because of the demand for some other commodity. .
      Example: Steel bricks and Cement are derived from houses or other buildings. All the factors of production are derived from demand.
  5. Composite Demand: Demand for goods that have multiple uses is called multiple or composite demands..
    • Example: Electricity and Milk.

Factors Affecting Demand:

  • Price of the commodity: When the price of the commodity increases the demand decreases and . when the price of the commodity decreases the demand increases. Price and demand are inversely related. This type of demand is known as price demand.
    1. P ↑ Increases D ↓ Decreases
    2. P ↓ Increases D ↑ Decreases
  • Price of related goods (also known as cross demand): Related goods can be classified into two kinds

Theory Of Demand And Supply Related Goods

  • Consumers’ Taste and Preferences: Taste and preferences depend on social customs and the habits of the people fashion and the general lifestyle of the people etc. if taste and preferences are strong for the product demand increases and if taste and preferences are weak and unfavourable for the product demand decreases.
  • Consumer Expectations regarding price in the future: If the consumer expects an increase in price in the future demand increases in the present. If the consumer expects a decrease in the price in the future demand decreases in the present.
  • Consumer credit facility: If credit facility to consumers is available demand increases. If credit facility to consumers is not available demand decreases. .
    Ex: Car loans are easily available in India that’s why there are so many cars in India.
  •  Income of the consumer: The relation between the income of the consumer and

The demand can be understood by taking three types of commodities:

  • Normal goods: Goods for those the demand increases with the increase in income of the consumer and decreases with the decrease in income of the consumer.
    • Examples: Furniture Television and clothes.
  • Inferior goods: Goods for those the demand falls with an increase in the income of the consumer and rises with the decrease in the income of the consumer. There is an inverse relationship between the income of the consumer and the demand for inferior goods.
    • Example: Maize and Bajara
  • Inexpensive goods of necessities: Goods for those the demand increases with an increase in income up to a certain level and thereafter it remains constant irrespective of the level of income.
    • Example: Salt and Matchbox

Factors Affecting Demand:

  1.  Size and Composition of Population:  The population size of a country determines the number of consumers.
    • With an increase in the size of the population, the demand for the commodity will increase.
    • The composition of a population refers to the various aspects of the population like the number of children adults males females etc. If the number of teenagers increases the demand for those goods that teenagers tend to buy increases.
    • Example: Jeans cricket bat will tend to increase.
  2. Government Policy: If the Government increases indirect taxes it leads to an increase in price and as a result, the demand decreases.
    1. If the government incurred more expenditure on the construction of roads bridges etc.
    2. The demand for construction goods will increase.
  3. Distribution of Income:
    • Case 1: If income is distributed evenly there will be more demand for essential goods.
    • Case 2: If income is distributed unevenly then there will be more demand for luxury goods.

Demand Function:
.
The functional relationship between the demand for a product and its factors is known as the demand function.

Law of Demand

It states that other things remain constant the quantity demanded of the commodity increases when its price falls and decreases when its price rises. The law of Demand explains the inverse relationship between price and quantity demanded.

Assumption of Law of Demand:

  1. The price of related goods is kept constant.
  2. The prices of the commodities are kept constant.
  3. Consumers’ tastes and preferences are kept constant.
  4. Consumers’ expectations regarding prices in the future are kept constant.
  5. Consumer credit facility.
  6.  The income of the consumers is kept constant. s
  7. Size and composition x>f the population are kept constant.
  8. Government Policies are kept constant.
  9. The distribution of Income is kept constant.

Exception to the Law of Demand:

  • Articles of Snob Appeal (Conspicuous Consumption): The Law of Demand does not apply to the commodities that serve as a status symbol increase social prestige and is a source of display and richness.
    • For example: Rich women would like to buy a diamond at a higher price to show their richness.
  •  Giffen goods:
    • Giffen goods are those inferior goods on which consumers spend a large part of their income.
    • Demand for this falls with the fall in their prices.
    • Example: Maize and Jawar.
  • Expectations regarding future price: 
    • If the price of a commodity is rising today it is likely to rise more in the future then people demand more at their existing higher price and store it up. . .
    • Similarly, when the consumer anticipates a large fall in the price of the commodity in the future they will postpone their purchase even if the price falls today. .
  • Quality price relationship:
    • Sometimes consumers take price as an index of quality in such cases more of the goods may be demanded at a higher price.
    • This is known as the Veblen effect.
    • Example: Like Lux Premium there is not much difference between Lux Premium and Lux International but a huge price difference. But people think that Lux International is better as it has a higher price.
  • Change in fashion: When a commodity goes out of fashion consumers will not demand even when its price is reduced.
  • Emergency: The law of Demand may not hold good during emergencies like wars famines droughts etc.
  •  Habitual goods: If the price of habitual goods increases demand does not decrease. Example: Cigarettes Wines.

Law of Demand Schedule

It is a tabular statement that shows different quantities of commodities demanded at different prices during a given period.

It is of two types:

  1. Individual demand schedule: It is the table that shows various quantities of the commodities demanded at different prices by a household/single consumer during a given period.
  2. Market demand schedule: It is the table that shows various quantities of commodities demanded at different prices by all the households in a market during a given period.

Individual demand schedule:

Theory Of Demand And Supply Individual Demand Schedule

Market Demand Schedule:

Theory Of Demand And Supply Market Demand Schedule

Law of  Demand Curve  

It is a graphical representation of different quantities demanded at different price levels.

1. Individual Demand Curve:

A graphical representation of different quantities demanded at different price levels by a single consumer.

Theory Of Demand And Supply Individual Demand Curve

2. Market Demand Curve:

A graphical representation of different quantities demanded at different price levels by all the consumers in a market.

Theory Of Demand And Supply Market Demand Curve

Reasons for Negatively Sloping Demand Curve:

1. Income Effect: 

  • A change in demand on account of a change in real income resulting in a change in the price of the commodity is known as the income effect.
  • When the price of the commodity falls it results in an increase
  • in purchasing power and the consumer can buy more and feel BETTER OFF”. –
  • On the other hand with an increase in price purchasing power decreases and the consumer reduces the demand and feels ‘WORSE OFF’

2. The Law of Diminishing Marginal Utility:

  • The law of diminishing marginal utility states that with an increase in the units of a commodity consumed every additional unit of the commodity gives lesser satisfaction.
  • Marginal utility falls with an increase in consumption.
  • A consumer will maximize his satisfaction when MUn = Price i.e. equilibrium condition.
  • If the seller wants to sell more he has to reduce the price of the. commodity.

3. Substitution effect:

  • The substitution effect refers to the change in demand for a good as a result of a change in the relative price ofthe good in terms of other goods.
  • Example: When the price of a good rises it becomes more expensive in terms of other goods in the market As a result consumers move av/ay towards its substitutes.
  • When the price of the commodity falls and prices of the substitute remain unchanged it becomes relatively cheaper in comparison to its substitutes. As a consequence demand for a commodity will increase.
  • Example: If the price of tea falls and the price of coffee remains the same then the demand for tea increases and the consumers will shift their demand from coffee to tea.

Price effect  = Income effect + Substitution effect

4. Increase In the number of consumers:

  • When the price of the commodity falls the number of consumers increases which increases the demand for the commodity.
  • It happens because at a very high price only a few people can afford to buy that commodity and when the price falls people with less income will also be able to purchase that commodity.

5. Several uses of a commodity:

  • When the price of commodities example. electricity and milk are very high they will be used for more important purposes only.
  • And thereafter small quantity will be in demand but when the price falls these commodities will be put to less important uses also leading to an increase in demand.
  • Example: Electricity will be used mainly for lighting purposes if the price  is high and the electricity will

Difference between Movement along the Demand Curve and Shift in the Demand Curve.

Theory Of Demand And Supply Difference Between Along The Demand Curve And Shift In Demand Surve

The difference between an Extension of Demand and an increase in Demand:

Theory Of Demand And Supply Extension Of Demand And Increase In Demand

Difference between contraction of Demond and decrease in Demand:

Theory Of Demand And Supply Difference Between Contraction Of Demand And Decrease In Demand

Elasticity of Demand

Meaning of Elasticity of Demand:

It refers to the degree of responsiveness of quantity demanded of a commodity to a change in any of its determinants.

Three main types of elasticities are:

  1. Price elasticity
  2. Income elasticity
  3.  Cross elasticity

1. Price Elasticity

It refers to the degree of responsiveness of a quantity demanded by a commodity to a change in price.

Symbolically:

ep = \(\text { ep }=\frac{\text { Percentage change in quantity demanded }}{\text { Percentage change in price }}\)

Degree / Classification of Price elasticity:

  1. Perfectly elastic demand – ep = ∝
  2. Perfectly inelastic demand.- ep = 0
  3. Unitary elastic demand.- ep = 1
  4. Greater than one/more elastic demand ep > 1
  5. Less than one/less elastic demand.- ep <1

Perfectly Elastic Demand:

When consumers are prepared to purchase all that they can get at a  particular price but nothing at all at a slightly higher price. The demand curve  is parallel to the X-axis

Theory Of Demand And Supply Perfectly Elastic Demand

Perfectly Inelastic Demand:

When the quantity demanded of a commodity does not respond to a change in its price then the elasticity of demand is equal to zero. The demand curve is  parallel to the y-axis.

Theory Of Demand And Supply Perfectly Inelastic Demand

Unitary Elastic Demand:

When the percentage change in the price of a commodity causes an equivalent percentage change in quantity demanded. The demand curve is a Rectangular hyperbola.

Theory Of Demand And Supply Unitary Elastic Demand

Greater than One/More Elastic Demand:

When the percentage change in quantity demanded of a commodity exceeds the percentage change in its price.

Theory Of Demand And Supply Greater One By More Elastic Demand

Multiple Choice Questions

Question 1. High-priced goods consumed by status-seeking rich people to satisfy their need for conspicuous goods” is:

  1. Veblen effect
  2. Bandwagon effect
  3. Snob effect
  4. Demonstration effect

Answer: 1.  Veblen effect

Veblen effect was given by Veblen. Hence it is called the Veblen effect also known as the prestige goods effect. It is related to conspicuous consumption. Veblen effect takes place as some consumers measure the utility by its price i.e. if the price rises they think that the commodity has got more utility. Veblen effect is the behavior practiced by rich people to satisfy their needs for conspicuous goods.

Question 2.

Theory Of Demand And Supply Elasticity At Point

  1. Elasticity at point A = ∞ at B = > 1 at C = 1 at D = < 1 and at E = 0
  2. Elasticity at A=0 at B = < 1 at C = 1 at D = > 1 and at E = ∞
  3. Elasticity at A = 0 at B > 1 at C = 1 at D = < 1 and at E = 0
  4. None of these.

Answer: 1.  Elasticity at point A = ∞ at B = > 1 at C = 1 at D = < 1 and at E = 0

Theory Of Demand And Supply Elasticity At Point Change In Demand Is Greater Than Price

  • When a change in demand is greater than the price change then e > 1
  • When a change in demand is less than the price change then e < 1
  • When a change in demand is the same as the change in price then it is e =1
  • When there is no change in demand as a change in price then e = 0
  • When the price changes slightly but demand change is higher then

Here C shows e = 1 by which we can prove that

C ⇒ e = 1, A ⇒ e = ∞,  B ⇒ e≥1

D ⇒ e<1, E ⇒ e = 0

Question 3. The cardinal approach is related to:

  1. Indifference curve
  2. Equi marginal utility
  3. Law of diminishing returns
  4. None of these.

Answer: 2. Equi marginal utility

Marginal Utility theory is given by Alfred Marshall. He assumes that the marginal utility theory is related to a cardinal approach which means we can measure the utility in terms of money. Marshall says Money is the measuring rod of utility”.

Question 4. An Increase in demand can result from: 

  1. A decline in the market price
  2. An increase in income
  3. A reduction in the price of substitutes
  4. An increase in the price of complements.

Answer: 2.

Price and demand are inversely related as the price rises demand falls and vice-versa. But income and demand are directly related. _A rise in income increases the quantity demanded and fall in income decreases the quantity demanded.

Question 5. The cross-elasticity of perfect substitutes is

  1. Zero
  2. Negative
  3. One
  4. Infinity

Answer: 4. Infinity

The cross elasticity of perfect substitutes is infinity as the rise in the price of one good will cause a rise in the demand for its substitutes.

Example: If the price of the tea rises the demand for coffee rises as these two are perfect substitutes. The cross elasticity of complementary goods leads to zero.

Question 6. Supply is a concept. 

  1. Flow
  2. Stock
  3. Flow and stock both
  4. Qualitative

Answer: 1. Flow

Supply refers to ‘the quantity of a good or service that consumers are willing and able to purchase during a given period. Supply is a concept as quantity supplied is so much per unit of time per day per week or year. It is regularly going on supply which means not only those goods which are sold but also those which are in stock.

Question 7. For what type of goods does demand to fall with a rise in income levels of households?

  1. Inferior goods
  2. Substitutes
  3. Luxuries
  4. Necessities

Answer: 1. Inferior goods

Inferior goods are the type of goods that are not of good quality and no one wants to consume these but circumstances force them – to consume them. If the income rises of households then demand for inferior goods goes down or elasticity for these goods becomes negative. .

Question 8. Which economist said that money is the measuring rod of utility? 

  1. A.C Pigou
  2. Marshall
  3. Adam Smith
  4. Robbins

Answer:  2. Marshall

Marginal Utility theory is given by Alfred Marshall.. He assumes that the marginal utility theory is related to a cardinal approach which means we
can measure the utility in terms of money. Marshall says Money is the measuring rod of utility”.

Question 9. Elasticity between two points:

  1. Point elasticity
  2. Arc elasticity
  3. Cross elasticity
  4. None.

Answer: 2. Arc elasticity

When price elasticity is to be found between two prices or two points on the demand curve then it is not possible to know what price and
. quantity should be taken as the base. So we use the Arc elasticity method to know the base price and quantity.

Question 10. If an indifference curve is L-shaped then two goods will be

  1. Perfect substitute goods
  2. Substitute goods
  3. Perfect complementary goods
  4. Complementary goods

Answer: 3. Perfect complementary goods

When two goods are perfect complementary goods (e.g. printer and cartridge) the indifference curve will consist of two straight lines with a right between them which is convex to the origin or in other words it will be L-shaped.

Question 11. The concept of consumer surplus is derived from

  1. The law of diminishing marginal utility.
  2. The law of equal-marginal utility.
  3. The law of diminishing returns
  4. Engel’s law.

Answer: 1. The law of diminishing marginal utility.

Consumer surplus is a surplus that a consumer would.be willing to pay rather than go without a commodity over that which he does pay. The concept of consumer surplus is given by Marshall and it is derived from = what a consumer is willing to pay – what he pays.

Question 12. When the supply curve shifts to the right there is

  1. An increase
  2. Expansion
  3. Contraction
  4. Decrease

Answer: 1. An increase

When the supply curve shifts to the right due to a change in one or more factors other than the price of the commodity. When the supply curve shifts to the right we say that there is an increase in supply and when the supply curve shifts. to the left, we say that there is a decrease in supply.

Question 13. Short-run price is also called by the name of

  1. Market price
  2. Showroom price.
  3. Maximum retail price
  4. None of these.

Answer: 1. Market price

Short-run price is also known as the market price and it is determined by the temporary equilibrium between the forces of demand and supply.

Question 14. When the supply price increases in the short run the profit of the producer

  1. Increases
  2. Decreases
  3. Remains constant ” .
  4. Decreases marginally

Answer: 1. Increases

Supply and price are directly related as the supply increases price increases and as the price decreases supply decreases. So increase in supply price will increase the profits of the producer.

Question 15. When the price of a commodity increases what will be the effect on the quantity demanded? 

  1. Increases
  2. Decreases
  3. No change
  4. None of these.

Answer: 2. Decreases

As per the law of demand other things being equal if the price of a commodity falls the quantity demanded of it will rise and if the price of a commodity rises its quantity demanded will fall.

Question 16. According to the law of supply change in supply is related to?

  1. Price of goods
  2. Price of related goods
  3. Factors of production.
  4. None of the above

Answer: 1. Price of goods

According to the law of supply change in supply is related to the price of goods. As other things remain constant the quantity of a good (produced and offered for sale) will increase if the price rises.

Question 17. In the case of inferior goods with a rise in the income of consumer’s demand for Giffen goods will ………..?

  1. Increases
  2. Decreases
  3. No change
  4. None of the above

Answer: 2. Decreases

In general cases, as consumer income rises they will prefer high-quality goods, and therefore demand for Giffen goods will decrease.

Question 18. In the case of necessaries, consumer surplus is?

  1. Infinite
  2. Zero
  3. Equals to one
  4. More than one

Answer: 1. Infinite

In the case of necessaries, the marginal utilities of the first few units are infinitely large. In such cases, the consumer surplus is always infinite.

Question 19. When the price of a commodity rises from 200 to ^ 300 and Quantity supply increases from 2000 to 5000 units find the elasticity of supply.

  1. 3.0
  2. 2.5.
  3. 0.3
  4. 3.5

Answer: 1. 3.0

⇒ \(\frac{\Delta q}{q} \times \frac{p}{\Delta p} \rightarrow \frac{3,000}{2,000} \times \frac{200}{100}\)

= 3.0.

Question 20. From the following data given below answer the question

Theory Of Demand And Supply Following From The Data

Total utility derived from 2nd unit:

  1. 380
  2. 20
  3. 100
  4. 280

Answer:  1. 380

TU = ∑MU

∴ 380

Question 21. The marginal utility of 3rd unit is?

  1. 200
  2. 280
  3. 100
  4. 50

Answer: 3. 100

MU = TUn – TUn-1

Therefore = 480 – 380

= 100

Question 22. Which Equation is correct

  1. \(\frac{M U x}{M U y}=\frac{P x}{P y}\)
  2. \(\frac{M U x}{M U y}>\frac{P x}{P y}\)
  3. \(\frac{M U x}{M U y}<\frac{P x}{P y}\)
  4. \(\frac{M U x}{M U y} \neq \frac{P x}{P y}\)

Answer:  1. \(\frac{M U x}{M U y}=\frac{P x}{P y}\)

The law of utility states that consumer equilibrium at the

⇒ \(\frac{M U x}{M U y}=\frac{P_x}{P_y}\)

Question 23. The scope of the indifference curve shows consumer equilibrium at the point where  MRS(xy) = \(\frac{P x}{P y}\) (Price line)

  1. Less than
  2. More than
  3. Equal to
  4. None of the above

Answer: 3. Equal to

Question 24. Which of the following is not the property of the indifference curve?

  1. IC is convex to the origin
  2. IG slopes downwards from left to right
  3. Two IC can touch each other
  4. IC cannot touch either of the axes

Answer: 3. Two IC can touch each other

The properties of the Indifference curve are:

  1. Indifference curves slope downward to the right
  2. Indifference curves are always convex to the origin.
  3.  Indifference curves can never intersect each other
  4. A higher. The indifference curve represents a higher level of satisfaction
  5.  The indifference curve will not touch either axis.

Question 25. In the case of Normal goods rise in price leads to?

  1. Fall in demand
  2. Rise in demand
  3. No change
  4. Initially rise then ultimately fall

Answer:  1. Fall in demand

In general cases when the price of the commodities rise the purchasing power of customers will fall and therefore demand will fall.

Question 26. The method of demand forecasting does not include?

  1. Mathematical method
  2. Barometric method
  3. Expert opinion method
  4. Statistical method

Answer:  1. Mathematical method

Methods of demand forecasting are:

  1.  Survey of buyers’ intentions
  2. Collection opinion method
  3. Expert opinion method
  4. Statistical method
  5. Controlled experiments
  6. Barometric method.

Therefore mathematical method is not a method of forecasting.

Question 27. If the price of the commodity increases what will be the effect on the quantity demanded?

  1. Decreases
  2. Increases
  3. No change
  4. Can’t say

Answer:  1. Decreases

As per the law of demand, other things remain constant when the price of a commodity increases quantity demanded decreases, and vice versa.

Question 28. An IC shows MRS between the commodities.

  1. Increasing
  2. Decreasing
  3. Constant
  4. Zero

Answer: 2. Decreasing

MRS is falling because as the consumer has more and more units of food he is prepared to give up less and Jess units of the commodity. –

Question 29. Forecasting of demand is the Art. and Science of predicting.

  1. Actual demand for a product at the same future date
  2. Probable demand in the future
  3. Total demand in the future
  4. None of these

Answer: 2. Probable demand in the future

Forecasting in general refers to knowing or measuring the status or nature of an event or variable before it occurs. Forecasting of demand is the art and science of predicting the probable demand for a product or a service.

Question 30. An addition made to total utility refers to the?

  1. Total utility.
  2. Average utility.
  3. Marginal utility
  4. All of the above.

Answer: 3. Marginal utility

Marginal utility is the addition made to the total utility by the consumption of an additional unit of a commodity.

Question 31. The elasticity of supply is zero means?

  1. Perfectly inelastic
  2. Perfectly elastic.
  3. Imperfectly elastic
  4. All of the above.

Answer: 1. Perfectly inelastic

The elasticity of supply:

  • e > 1 ⇒ Elastic supply .
  • e < 1 ⇒  Inelastic supply
  • e = 0 ⇒ Perfectly inelastic supply
  • – e = ∞ ⇒ Perfectly elastic supply
  • e = 1 => Unit elastic .

Therefore the elasticity of supply is zero means it is a perfectly inelastic supply.

Question 32. The Consumer is in equilibrium when the following condition is satisfied:

  1. The budget line is tangent to the Ic curve
  2. \(\frac{M U_X}{P_X}=\frac{M U_Y}{P_Y}=\frac{M U_Z}{P_Z}\)
  3. Both (1) and (2)
  4. None of the above

Answer: 3. Both (1) and (2)

The condition for consumer attaining equilibrium is the point where the budget line is tangent to the indifference curve and \(\frac{M U_X}{P_X}=\frac{M U_Y}{P_Y}\)

Question 33. Which of the following statements is correct?

  1. Supply is inversely related to its cost of production
  2. The price and quantity demand of a good have a direct relationship
  3. Taxes and subsidies has no impact on the supply of the product
  4. Seasonal changes have no impact on the supply of the commodity

Answer: 1. Supply is inversely related to its cost of production

In economics, supply refers to the quantity of products available in the market for sale at a specified price at a given point in time.

The supply of a product has an inverse relation with the cost of production. Example A seller would supply less quantity of product in the market when the cost of production exceeds the market price of the product. In such a case, the seller would wait for a rise in the price of the product.

Question 34. When the supply of a product is perfectly inelastic then the curve will be

  1. Parallel to Y-axis
  2. Parallel to X-axis
  3. At the angle of 45°
  4. Sloping upwards

Answer: 1. Parallel to Y-axis

Theory Of Demand And Supply Inelastic Then The Curve

If due to a change in the price the quantity supplied of goods remains unchanged such goods are said to have inelastic supply i.e. their supply cannot be changed. This is shown by the vertical supply curve i.e. curve parallel to Y-axis.

Question 35. In the case of ___________________ there is an inverse relationship between income and demand for a product.

  1. Substitute goods
  2. Complementary goods
  3. Giffen Goods
  4. None of the above

Answer: 3. Giffen Goods

Giffen goods are the products for which demand increases as the price increases and falls when the price decreases. This is a special case of inferior goods which people buy less when thei income rises. Hence an inverse relationship is established between income and demand of the product.

Question 36. If maize has – 0.30 as income elasticity of demand then maize will be considered as.

  1. Necessity
  2. Inferior good.
  3. Superior good
  4. None

Answer:  2. Inferior good.

Since the income elasticity of maize is  .30 < 0 it is an inferior commodity in the eyes of the household. The demand for inferior goods falls as income rises. Also as the elasticity is less than one it shows that the goods are either relatively less important in the consumer’s eye or it is a necessity.

Question 37. If the price decreases from 80 to 60 and the elasticity of demand is 1.25 then

  1. Demand increased by 25%
  2. Demand decreased by 25%
  3. Remains constant
  4. None of the above

Answer: 4.  None of the above

Price Elasticity = Percentage change in quantity demanded

Percentage change in price

Given ⇒ Elasticity = 1.25 % change in price = \(\frac{60-80}{80}\) 25%

1.25 %  = Change in Quantity / 25%.

Increase in Demand = -31.25%

Question 38. Which of the following are the conditions of the theory of consumer surplus if the price is the same for all the units he purchased?

  1. The consumer gains extra utility or surplus
  2. The consumer surplus for the last commodity is zero.
  3. Both
  4. None

Answer: 3. Both

The concept of consumer surplus is based on the law of diminishing marginal utility. If a consumer gets extra of something its marginal unity
starts decreasing.

Keeping the price the same for all the commodities a consumer gets extra utility for the units consumed by him except the one at the margin i.e. the last unit. The extra utility obtained
by the consumer is known as consumer surplus.

Question 39. Which of the following is not the property of an indifference curve?

  1. Slopes downwards to the right
  2. Always convex to the origin
  3. Intersects each other
  4. Will not touch either of the axes

Answer: 3. Intersects each other

The following are the properties of indifference curves:

  •  It slopes downwards to the right
  •  It is convex to the origin
  • Two ICs never intersect each other-
  • Higher IC represents a higher level of satisfaction.
  • IC never touches either ax

Thus option (3) is not the property of an indifference curve.

Question 40. Which of the following is correct?

  1. Elasticity on the lower segment of the demand curve is greater than the unity
  2. Elasticity on the upper segment of the demand curve is lesser than unity
  3. Elasticity at the middle of the demand curve is equal to unity
  4. Elasticity decreases as one moves from the lower part of the
  5. Demand curve to the upper part

Answer: 3. Elasticity decreases as one moves from the lower part of the

Point elasticity at any point can be measured by the following formula

RT/ RT=  Lower segment / Upper segment

  • Elasticity on the lower segment of the demand curve is less than 1
  • Elasticity at the middle of the demand curve is equal to unity
  • Elasticity on the upper segment of the demand curve is more than 1
  • Elasticity increases on one moves from the lower part of the demand curve to upper part.

Question 41. Which of the following will affect the demand for non-durable goods?

  1. Disposable Income
  2. Price.
  3. Demography
  4. All of the above

Answer: 4. All of the above

Factors affecting the demand for non-durable consumer goods are

  1. Disposable income
  2. Price
  3. Demography

Question 42. When the price of tea decreases people reduce the consumption of coffee. Then the goods are

  1. Complementaries
  2. Substitutes
  3. Inferior goods
  4. Normal goods

Answer: 2. Substitutes

Substitute goods are those goods that can be interchangeably used. Example tea and coffee ink pen and ball pen. If the price of a product falls people will try it and thus the demand for the other product will fall.

Theory Of Demand And Supply Price Coffe And Tea Demond

Question 43. Which of the following relations is true with MU?

  1. When MU is positive Total utility rises at a diminishing rate
  2. When marginal utility is zero total utility is maximum
  3. When marginal utility is negative total utility is diminishing
  4. All of the above

Answer: 4. All of the above

The relationship between marginal utility (MU) and Total Utility (TU) is as follows:

  • When MU decreases TU increases at a decreasing rate
  • When MU is zero TU is maximum
  • When MU becomes negative TU declines.

Theory Of Demand And Supply Relation Is True With MU Marginal Utility

Question 44. The price elasticity of demand at the midpoint of the straight-line demand curve under the point method is 

  1. 0
  2. 1
  3. >1
  4. <1

Answer:  2. 1

Given a straight line demand curve point elasticity can be calculated through.

RT / Rt =  Lower segment / Upper segment

Theory Of Demand And Supply Elasticity At Various Points

Thus, the price elasticity of demand at the midpoint under point method 1

Question 45. Contraction of supply implies.

  1. Decreased cost of production
  2. Decrease in price of the good concerned
  3. Decrease in price of related good
  4. Increase in price of the good concerned

Answer: 2. Decrease in price of the good concerned

Contraction in supply is the result of a decrease in price of the goods concerned.

Theory Of Demand And Supply Price Of Goods Concerned

Question 46. Perishable commodities will have.

  1. Perfectly elastic curve
  2. Perfectly inelastic curve
  3. Elastic
  4. Inelastic

Answer: 2. Perfectly inelastic curve

The supply curve of perishables goods is perfectly inelastic. Perishable goods cannot be stored for a long time if stored the same will be
wasted thus its supply is limited and cannot be changed in the short run.

Question 47. Supply is a_______________ concept.

  1. Flow
  2. Stock
  3. Both (1) and (2)
  4. None of the above

Answer: 1. Flow

Supply refers to what a firm offers for sale in the market not necessarily to what they succeed in selling. What is offered may not get sold.

Supply is a flow concept. The quantity supplied is ‘so much’ per unit of time per day per week or year.

Question 48. Total utility is also known as

  1. Total satiety.
  2. Aggregate satiety.
  3. Full satiety
  4. Half satiety.

Answer: 1. Total satiety.

Total utility is measurable and additive total utility may be defined as the sum of utility derived from different units of a commodity consumed by a consumer.

Total utility is the sum of total marginal utilities derived from the consumption of different units i.e.

TU = MU1 + MU2 + …………………… + MUn

∴We can say that total utility is also known as total satiety.

Question 49. A vertical supply curve parallel to the axis implies the elasticity of supply is

  1. Zero
  2. Infinity.
  3. Equal to one
  4. Greater than zero but less than infinity

Answer: 1. Zero

A Vertical supply curve parallel to the y-axis implies that the elasticity of supply is Zero.

Theory Of Demand And Supply Vertical Supply Of Curve Parallel To Y axis

Question 50. The budget line is also called

  1. Price line
  2. Iso cost line
  3. Iso-quant
  4. None

Answer: 1. Price line

The budget line shows all those combinations of two goods which the consumer can buy spending his given money incomes on the two goods at their given prices. All those combinations are within the reach of the consumer. Will lie on the budget line.

∴ Px Oy + Py Qy≤ B

The budget line is also called the price line.

∴ Px Qx ⇒ Price and Quantity of good

Py Qy ⇒ Price and Quantity of good Y

B is the Budget

Theory Of Demand And Supply Budget Line

Question 51. The Quantity supplied of goods or services is the amount that

  1. As bought during a given period at a given price.
  2. Producers wish they could sell at a higher price
  3. Producers plan to sell during a given period at a given price.
  4. People are willing to buy during a green period at a given price.

Answer: 3. Producers plan to sell during a given period at a given price.

The quantity supplied of a good or service is the amount that producers plan to sell during a given period at a given price. The quantity supplied of a good also depends upon the government’s industrial and foreign policies goals of the firm infrastructural facilities etc.

The law of supply states that other things remaining constant the quantity of a good produced and offered for sale will increase as the price of the good rises and decreases as the price falls.

Theory Of Demand And Supply The Quantity Supplied Of A Goods

Question 52. Luxury goods have an income elasticity

  1. Negative and less than 1
  2. Positive and greater than 1
  3. Zero
  4. None

Answer:  2. Positive and greater than 1

Luxury goods have income elasticity is positive and greater than one

Demand for luxury goods arises beyond a certain level of consumers’ income and keeps on rising as income increases

Example: Car, TV etc

Elasticity is greater than one when the percentage change in quantity demanded is greater than the percentage change in price.

Theory Of Demand And Supply Demand Of Luxury Goods

Question 53. Percentage change quantity supplied is divided by to obtain elasticity of supply

  1. Percentage decrease in price
  2. Percentage change in price
  3. Both (1) and (2)
  4. None

Answer:  2. Percentage change in price

Percentage change in quantity supplied is divided by percentage change in price to obtain elasticity of supply.

Es=   Percentage change in Quantity Supplied / Percentage change in Price

Question 54. If the price of the product is? 20 per unit and if the price decreases by 5% as a result of which quantity demanded increases by 10% find MR- old quantity is 10 units.

  1. 9
  2. 19
  3. 10
  4. 12

Answer: 1. 9

Theory Of Demand And Supply Price Of The Product

MRn= TRn -TRn-1

MR11= TR1 -TR11-1

MR11=209-200

MR11=  9

Question 55. Law of demand relates to:

  1. Price only
  2. Price and quantity demanded of a good
  3. Quantity demanded only
  4. Supply

Answer: 2. Price and quantity demanded of a good

The law of demand relates to the price and quantity demanded of a good. As Prof. Alfred Marshall” defined the Law of Demand as – The greater the amount to be sold the smaller the price at which it is offered so that it may find purchasers or in other words, the amount demanded increases with a fall In price and diminishes with a price rise.

Theory Of Demand And Supply Relates To Price And Quantity Demanded Of Good

Question 56. An indifference curve slopes down towards the right since more of one commodity and of another commodity results in

  1. The same level of satisfaction
  2. Maximum satisfaction
  3. Greater satisfaction
  4. Less satisfaction

Answer:  1. Same level of satisfaction

The indifference curve slopes down towards the right since more of one commodity and of another commodity result in the same level of – satisfaction. The downward slope of the indifference curve states that two commodities can be substituted for each other and when the amount of one good in the combination is increased the amount of the other good is reduced. This is essential if the level of satisfaction is to remain the same on an indifference curve.

Theory Of Demand And Supply Indifference Curve

Question 57. Elasticity for habitual goods is.

  1. Perfectly elastic
  2. Elastic
  3. Perfectly inelastic
  4. Inelastic

Answer: 4. Inelastic

Elasticity for habitual goods is inelastic. Elasticity is less than one when the percentage change in quantity demanded is less than the percentage change in price. In such cases, demand is said to be inelastic.

EP =  Percentage Change Quantity Demanded / Percentage Change in Price

Question 58. Diminishing marginal returns for the first four units of variable inputs are exhibited by the total product sequences.

  1. 50, 100, 150, 200
  2. 50, 50, 50, 50
  3. 50, 110, 150, 260
  4. 50, 90, 120, 140

Answer: 4. 50, 90, 120, 140

Theory Of Demand And Supply Diminishing Marginal Returns

Question 59. Demand forecasting using asking customers what they are going to buy comes under:

  1. Survey of buyers’ intentions
  2. Statistical method
  3. Grassroots method
  4. Expert opinion method

Answer: 1. Survey of buyers’ intentions

Survey of buyers’ intention – a forecasting technique in which known purchasers of a product are asked to predict their requirements for a given future period.

Question 60. When the price of petrol decreases people reduce the consumption of diesel then the goods are:

  1. Mixed
  2. Complementary
  3. Superior
  4. Substitutes

Answer: 4. Substitutes

Substitute goods are two alternative goods that could be used for some purpose. When the price of petrol decreases people reduce the
consumption of diesel.

Question 61. The price of an apple is ₹ 120 per kg. Ram buys one kg. of apples at that price. Now if other things remain the same but the price of apples falls to? 90 per kg. Now Ram buys 2 kg of apples. It is called as:

  1. Contraction of demand
  2. Expansion of demand
  3. Market demand
  4. Demand schedule

Answer: 2. Expansion of demand

Expansion in demand refers to a rise in the quantity demanded due to a fall in the price of a commodity other factors remaining constant leads to a downward movement along the demand curve.

Question 62. To know the base price and quantity which method of elasticity is used?

  1. Arc Elasticity.
  2. Cross Elasticity
  3. Point Elasticity
  4. Zero Elasticity

Answer: 1. Arc Elasticity.

In Arc elasticity it can be calculated by using the formula:

Ep = (q1– q2)/(q1+ q2)× (p1+p2)/(p1 – p2)

This is because elasticities found by using original price and quantity figures as a base will be different from the ones derived by using new price and quantity figures.

Question 63. The price elasticity of demand for X is 1 and the average quantity demand of X is 90 units. If the price of X decreases from ₹ 300 to ₹ 180 per unit calculate the new quantity demand of X is: 

  1. 126 units
  2. 36 units
  3. 144 units
  4. 120 units

Answer: 1. 126 units

It can be calculated by using the formula:

e = (Q1– Q0)/(Q0) × (P0)/(P1– P0)

⇒ 1 = (Q1– 90)/(90) × (300)/(300-180)

Q1 = 126 units

Question 64. If the quantity supply changes substantially in response to small changes in the price of the good then it is:

  1. Relatively greater elastic supply
  2. Relatively less elastic supply
  3. Unitary elastic
  4. Perfect elastic

Answer: 1. Relatively greater elastic supply

If the elasticity of supply is greater than one i.e. when the quantity supplied of good changes substantially in response to a small change in the price of the good we say that supply is relatively elastic.

Question 65. If the Indifference curve is L shaped means two goods will be:

  1. Perfect complementary goods
  2. Perfect substitute goods
  3. Perfect inferior goods
  4. Perfect superior goods

Answer: 1. Perfect complementary goods

When two goods are perfect complements they are represented by a ‘L’ shaped indifference curve.

Question 66. Let us assume that in the OY axis, we have good A and on the OX axis good B. If the price of good B increases by ? 1 but the price of good A remains constant and income also remains unchanged the budget line will shift:

  1. Right on the OY axis
  2. Right on the OX axis
  3. Left on the OY axis
  4. Left on the OX axis.

Answer:  4. Left on the OX axis.

Theory Of Demand And Supply Left OnThe OX Axis

Left on ox axis

In this diagram, we can see that good B has shifted leftward towards the ox-axis.

Question 67. Purushotham wanted to buy a laptop by paying. 60000 but the actual price is? 55000 then the consumer surplus is:

  1. ₹ 60000
  2. ₹ 55000
  3. ₹5000
  4. ₹ 6500

Answer: 3. ₹5000

Consumer’s surplus = What a consumer is ready to pay – What he pays

∴ Consumer’s Surplus = 60000 – 55000

= ₹ 5000.

Question 68. Effective demand depends on.

  1. Price
  2. Cost
  3. Desire
  4. Product

Answer: 1. Price

Effective demand depends upon various factors but according to the given question, it mainly depends upon price.

Question 69. Why does the demand curve slope downwards?

  1. Law of diminishing marginal cost
  2. Arrival of old consumers
  3. Cost effect.
  4. Different users

Answer: 2.  Arrival of old consumers

Generally demand curve slopes downward from left to right. It is due to many reasons such as the law of diminishing marginal utility price effect substitution affects the arrival of old consumers and many uses of a commodity.

Question 70. What is not a determinant of demand?

  1. Consumer’s expectations
  2. Consumer’s tastes and preferences
  3. Income of the consumers.
  4. Prices of unrelated goods.

Answer: 4. Prices of unrelated goods.

Demand depends upon various determinants such as price income taste and preference price of related commodities climatic factors etc.

Question 71. What are the exceptions to the Law of Demand

  1. Law of Diminishing Marginal Utility
  2. Substitution effect
  3. Conspicuous goods
  4. Different uses.

Answer: 3. Conspicuous goods

Generally law of demand slopes downward but sometimes it slopes upward which is known as an exception to the law of demand. The various reasons are Giffen goods conspicuous goods during. emergencies etc.

Question 72. Identify the factor which generally keeps the price elasticity of a good. law:

  1. Variety of uses for that good
  2. Very low price of a commodity
  3. Close substitutes for that good
  4. A high proportion of the consumer’s income is spent on it.  (Tmark) Answer:

Answer:  2.  Very low price of a commodity

Question 73. In the case of inferior goods, the income elasticity of demand is

  1. Positive
  2. Zero
  3. Negative
  4. Infinite

Answer: 3. Negative

In the case of inferior goods, the income elasticity of demand is Negative which means that due to the increase in income, the quantity consumed (inferior goods) decreases The price elasticity of a good is low if the price of a commodity is very low. low i.e. it is inelastic.

Question 74. What is a numerical measure of elasticity for Perfectly Elastic”

  1. Zero
  2. Infinity
  3. Greater than one and less than infinity.
  4. Less than one

Answer: 2. Infinity

The numerical value of elasticity of perfect elastic = (∞)

Theory Of Demand And Supply The Numerical Value Of Elasticity Of Perfect Elastic

Question 75. The price of 1 kg. of tea is ₹ 30 demand at this price is 5 kg. If the price of coffee rises from 25 to 35 per kg. the quantity demanded of tea rises from 5kg. to 8 kg. Find out the cross elasticity of tea.

  1. -1.5
  2. 1.5
  3. 3
  4. 1

Answer: 2. 1.5

Cross Elasticity = Δ qx/Δ py × py/qx

Where x = Tea , y = Coffee

= \(\frac{5-8}{-10}\)× \(\frac{25}{5}\)

=  \(\frac{+3}{+10}\)× \(\frac{25}{5}\)

= +1.5

Question 76. Supply is a concept.

  1. Flow.
  2. Stock
  3. Flow and Stock
  4. None of the above.

Answer: 1. Flow

Supply is a flow concept. The quantity supplied is so much per unit of time per day per week or per year.

Question 77. When supply curves move to the right it means:

  1. Supply increases
  2. Supply decreases
  3. Supply remains constant.
  4. Supply expands

Answer: .1. Supply Increases.

When supply curves move to the right it means an increase in supply.

Theory Of Demand And Supply Supply Increases

Question 78. The second glass of lemonade gives lesser satisfaction to a thirsty boy. This is a clear case of:

  1. Law of demand
  2. Law of diminishing returns
  3. Law of diminishing marginal utility
  4. Law of supply.

Answer: 3. Law of diminishing marginal utility

The second glass of lemonade gives lesser satisfaction to a thirsty boy. This is a clear case of diminishing marginal utility.

Question 79. The quantity demanded of coffee increases by 2% when the price of tea – increases by 8% the cross elasticity of demand between two product
are:

  1. -0.30
  2. + 0.30
  3. +0.25
  4. – 0.25

Answer:  3. +0.25

Cross elasticity =  Percentage change in quantity demanded/ Percentage change in Price

⇒ \(\frac{2}{8}\) %

= 0.25

Question 80. Goods which are inferior with no close substitutes easily available and which occupy a substantial place in consumer’s budget are called goods.

  1. Giffen
  2. Conspicuous
  3. Speculative.
  4. Prestige.

Answer: 1. Giffen

Such goods that exhibit a direct price-demand relationship are called Giffen goods. Giffen goods are those inferior goods whose demand increases as their price increases. Those goods that are inferior with no close substitutes easily available and which occupy a substantial place in consumers’ budgets.

Question 81. Suppose the demand for automobiles decreases due to an increase in the price of petrol both the goods are:

  1. Normal
  2. Substitute
  3. Perishable
  4. Complementary

Answer:  4. Complementary

Complementary goods are those goods which are consumed together or simultaneously for example automobile and Petrol. When two commodities are
complements a fall in the price of one will cause the demand for the other to rise.

Question 82. Marshall defined the concept of consumer surplus as the.

  1. The area covered  in between the average revenue and marginal revenue curve
  2. Difference between the maximum amount a person is willing to pay far goods and the amount he pays
  3. The area inside the budget line
  4. Difference between the minimum amount a person is willing to pay for a good and its market price

Answer: 2.  Area covered in between the average revenue and marginal revenue curve

Marshall defined the concept of consumer Surplus as the difference between what a consumer is ready to pay and what he actually pays.

Question 83. Of the following who developed the Delphi technique of Demand forecasting? 

  1. Olaf Helmer.
  2. David Richardson
  3. Michael Porter
  4. J.M. Keynes

Answer: 1. Olaf Helmer.

The Delphi technique developed by Olaf Helmer at the Rand Corporation of the USA provides a useful way to obtain an informed judgment from diverse experts by avoiding disadvantages. conventional panel meeting. .

Question 84. Indifference curve analysis is based on which approach?

  1. Nominal.
  2. Cardinal.
  3. Marginal
  4. Ordinal

Answer: 4. Marginal

Indifference curve analysis is based on the ordinal approach. The indifference curve analysis assumes that utility is only ordinally expressible. The consumer is capable of ranking all conceivable combinations of goods according to satisfaction.

Question 85. Read the following table and answer questions no
Answer: 

Theory Of Demand And Supply Quantity Consumed And Total Utility

What is marginal utility consumption increases from 4 units to units:

  1. 130
  2. 80
  3. 160
  4. 100

Answer:  2. 80

Marginal utility =Tun-Tun-1

= Tu5 – Tu4

= 830 – 750

= ₹ 80

Question 86. What is Marginal utility when consumption increases from 7 units to 8 units?

  1. 60.
  2. 100
  3. 40
  4. 30.

Answer: 4. 30

Marginal utility = Tun-Tun-1

= Tu8 – Tu(8-1)

= Tu8 – Tu(7)

= 960 – 930

= ₹ 30

Question 87. The price of a commodity decreases from? 200 to? 120 per unit. If the price elasticity of Demand for this commodity is 2 and the original. quantity demanded is 60 units calculate the new quantity demanded.

  1. 48 units
  2. 100 units
  3. 120 units
  4. 108 units.

Answer: 4.

Original quantity demanded = 60 units

Elasticity = 2 times.

Original price = ₹ 200

New prices =₹ 120.

Price elasticity = ΔQ/Δ P × P/Q

2 = ΔQ/80 × 200/60

ΔQ = 48

New quantity = original quantity + A Q = 60 units + 48 units

= 108 units.

Question 88. A group of people decreases or altogether stops consumption of a common product due to which of the following effect?

  1. Veblen effect
  2. Demonstration effect.
  3. Bandwagon effect
  4. Snob effect.

Answer: 4. Snob effect.

When a product becomes common among all some people decrease or altogether stop its consumption this is called the snob effect. .

Question 89. Highly-priced goods are consumed by status-seeking rich people to satisfy their need for conspicuous consumption. This is called:

  • Veblen effect
  • Demonstration effect
  • Snob effect
  • Bandwagon effect

Answer: 1. Veblen effect

Veblen effect was given by Veblen. Hence it is called the Veblen effect also known as the prestige goods effect. The Veblen effect takes place as some consumers measure the utility by its price i.e. if the price rises. them they think that commodities have got more utility. The Veblen effect is the behavior
practiced by rich people to satisfy their need for conspicuous goods.

Question 90. Which of the following product elasticity of demand is highly elastic?

  1. Salt
  2. Jewellery
  3. Life-saving medicines
  4. Water.

Answer: 2. Jewellery

Jewellery has the elasticity of demand is highly elastic because due to an increase in the price of jewelry, more will be demand on the other hand

necessaries goods like salt water medicines are elastic.

Question 91. The indifferences curve for two perfect complementary goods is

  1. Z shaped
  2. L shaped
  3. U shaped
  4. .Straight line

Answer: 2. L shaped

When two goods are perfect complementary goods (e.g pointer and cartridge) the indifference curve will consist of two straight lines with a right angle bent which is convex to the origin or in other words it will be L-shaped.

Question 92. Assume that wheat has (-) 0.4 as income elasticity by this we can say:

  1. Wheat is normal and good.
  2. Wheat is an inferior good
  3. Wheat is a superior good
  4. Wheat is a luxurious good

Answer: 2. Wheat is an inferior good

Since the income elasticity of wheat is – 0.4 < 0 it is an inferior good. The demand for inferior goods falls as income rises. Also, the elasticity is less than one it shows the goods is either relatively less important in the consumer’s eye or it is a necessity.

Question 93. The equation of supply is given as Q = 20p – 200. If the price is? 30 then find the elasticity.

  1. +1.5
  2. – 0.5.
  3.  0.66
  4. -0.66

Answer: 1. +1.5

The elasticity of demand measures how the quantity demanded of a commodity will change in response to the changes in its price. The elasticity of a good depends on the factors like nature of the good availability of substitutes income level share in the expenditure etc.

Hence

Es = dq/dp ×p/q

Since dq/dp   = 20

P = 30

q = 20 × 30 – 200

q = 400

∴ Es = \(\frac{20×30}{400}\)

= 1.5

Question 94. Who coined the term ‘Demonstration effect’?

  1. Adam Smith
  2. Veblen
  3. James Duesenbury.
  4. Alfred Marshall

Answer: 3. James Duesenbury.

James Duesenberry (1949) gave the name”demonstration effect” to this phenomenon arguing that it promoted unhappiness with current levels of consumption which impacted savings rates and consequently opportunities for macroeconomic growth.

Question 95.MRS from X to Y can be defined as

  1. Change in Y to change in X
  2. Px/Py
  3. py/px
  4. Change in X to change in Y

Answer:  2. Px/Py

MRS is calculated between two goods placed on an indifference curve displaying a frontier of utility for each combination of “good X” and “good Y.” The slope of this curve represents quantities of good X and good Y that you would be happy substituting for one another.

Question 96. In the case of goods, the demand will rise to the fall of price only if the substitution effect outweighs the income effect.

  1. Inferior goods
  2. Necessaries
  3. Giffen goods
  4. Luxury goods.

Answer:  1. Inferior goods

The increase in demand on account of an increase in real income is known as income effect. When the price of a commodity falls the consumer can buy the same quantity of the commodity with less money or he can buy more of the same commodity with the same amount of money.

  • In other words as a result of a fall in the price of the commodity consumer’s real income or purchasing power increases.
  • A part or whole of the resulting increase in real income can now be used to buy more of the commodity in question given that the good is normal.
  • Therefore the demand for that commodity (whose price has fallen) increases.
  • However, there is one exception. In the case of inferior goods, the income effect works in the opposite direction to the substitution effect.
  • In the case of inferior goods, the expansion in demand due to a price fall will take place only if the substitution effect outweighs the income effect.

Question 97. The value of demand elasticity can be taken from

  1. – 1 to + 1
  2. – 1 to ∞
  3. 0 to ∞
  4. – 1 to 0

Answer: 1. – 1 to + 1

The elasticity of demand for a given good or service is calculated by dividing the percentage change in quantity demanded by the percentage change in price. If the elasticity quotient is greater than or equal to one the demand is considered to be elastic.

Question 98. Consumer surplus is derived from which concept?

  1. Law of Diminishing Marginal Utility
  2. Law of consumer surplus
  3. Law of indifference curve.
  4. Maximization of Profits

Answer: 1. Law of Diminishing Marginal Utility

Consumer surplus is derived from the law of Diminishing Marginal utility. Consumer surplus is based on the economic theory of marginal utility which is the additional satisfaction a consumer gains from- one more unit of a good or service. Consumer surplus always increases as the price of a good falls and decreases as the price of a good rises.

Question 99. The law of Diminishing Marginal Utility is derived from.

  1. Indifference curve
  2. Consumer surplus
  3. Maximization of profits ‘
  4. Expansion of firm

Answer: 2. Consumer surplus

The law of diminishing marginal utility states that all else equal as – consumption increases the marginal utility derived from each additional unit declines. Marginal utility is the incremental increase in utility that results from the consumption of one additional unit i.e. consumer surplus.

Question 100. Hicks and Allen believed that utility

  1. Can be measured in ordinal numbers.
  2. Can be measured in cardinal numbers
  3. Can be measured
  4. Cannot be measured

Answer: 1. Can be measured in ordinal numbers.

Hicks and Allen believed that utility can be measured in ordinal numbers. The ordinal analysis of demand is based on the indifference curve which represents the consumer’s preferences graphically. An indifference curve is a curve that represents all those combinations of two goods that give the same satisfaction to the consumer.

Question 101. At the point of satiation, TU is and MU is.

  1. Maximum zero
  2. Minimum Minimum
  3. Zero Maximum
  4. Maximum Maximum.

Answer:  1. Maximum zero

When Marginal Utility is Zero Total Utility is the maximum and it is the point of maximum satisfaction i.e. point of satiety.

Question 102. Demand refers to

  1. Need for a commodity
  2. Use for a commodity *
  3. Unlimited wants
  4. It is a desire backed by purchasing power ability and willingness to pay.

Answer: 4. It is a desire backed by purchasing power ability and willingness to pay.

The effective demand for a thing depends on:

  1. Desire
  2. Means purchasing and
  3. Willingness to use.

Those means for that purchase. Unless desire is backed by purchasing power or ability to pay and willingness to pay it does not constitute demand. Effective demand alone would figure in economic analysis and business decisions.

Question 103. Budget Line will be affected by

  1. Change in demand
  2. Change-in income
  3. Change in supply
  4. Change in equilibrium

Answer: 2. Change-in income

The budget constraint can be explained by the budget line or price line. In simple words, a budget line shows all those combinations of two goods which the consumer can buy spending his given money income on the two goods at their given prices. All those combinations that are within the reach of the consumer (assuming that he spends all his money and income) will lie on the budget line.

Question 104. Utility can be measured in

  1. Units
  2. Utils
  3. Points
  4. Numbers

Answer:  2. Utils

According to the neoclassical economists utility is a cardinal concept i.e. utility is a measurable and quantifiable entity. It implies that utility can be measured in cardinal numbers and may be assigned a cardinal number like 12 3 etc.

Marshall and some other economists used a psychological unit of measurement of a utility called utils. According to Marshall utility is the numerical score in terms of ‘utils’ representing the satisfaction that a consumer obtains from the consumption of a particular good. (Utils refer to the hypothetical measuring unit of utility).

Question 105. Which of the following is the property of IC?

  1. IC is concave to the origin
  2. ICs intersect each other –
  3. IC slopes upward to the left
  4. IC does not touch either the x-axis or y-axis

Answer: 4. IC does not touch either the x-axis or y-axis

The four properties of indifference curves are:

1. Indifference curves can never cross

2. The farther out an indifference curve lies the higher the utility it indicates

3. Indifference curves always slope downwards and

4. Indifference curves are convex.

Question 106. The dealings of Aeroplanes as given below are__________

Theory Of Demand And Supply Dealings Of Aeroplanes

This represents________

  1. Perfectly inelastic demand
  2. Perfectly elastic demand
  3. Unit Elastic
  4. Relative inelastic.

Answer: 1. Perfectly inelastic demand

Question 107. During lockdown due to covid 19, a consumer finds that vegetable vendors selling vegetables in the streets have raised the prices of vegetables than usual prices. She will buy  vegetables than  as her usual demand showing the demand for vegetables is

  1. Same; Elastic demand
  2. Same; Inelastic demand .
  3. Less; Elastic demand
  4. More; Inelastic demand

Answer:  2. Same; Inelastic demand.

During lockdown due to covid 19, a consumer finds the vegetable vendors selling vegetables in the streets have raised the prices of vegetables than usual prices. She will buy the same vegetable/as her usual demand showing the demand for vegetables is Inelastic demand.

Question 108. For Giffen goods, the angle curve is: 

  1. Vertical
  2. Horizontal
  3. Negatively slopped
  4. Positively slopped

Answer: 3. Negatively slopped

For Giffen goods, the angle curve is negatively slopped. A Giffen good is a low-income non-luxury product that defies standards. economic and consumer demand theory. Demand for Giffen goods rises when the price rises and falls when the price falls. In econometrics this results in an upward-sloping demand curve contrary to the fundamental laws of demand which create a downward-sloping demand curve.

Question 109. Elasticity is measured at a given point on the supply curve

  1. Point elasticity.
  2. Arc elasticity
  3. Cross elasticity
  4. None of the above.

Answer:  1. Point elasticity.

The point elasticity of demand is the price elasticity of demand at a particular point on the demand curve. The price change. elasticity when is infinitesimal (very negligible) we use point elasticity.

Question 110. Price change is larger than proportionate to change in demand which type of elasticity?

  1. Elastic
  2. Infinite
  3. Zero
  4. Inelastic

Answer: 4. Inelastic

Demand is inelastic. when price change is larger than proportionate the change in demand.

Elasticity < 1

Demand curve of elasticity less than one.

Question 111. Veblen effect slopes toward

  1. Downward to
  2. Upward
  3. Negative
  4. Positive

Answer: 2. Upward

The demand curve for a veblen good is upward sloping contrary to a normal demand curve which is downward sloping. When the price of a Veblen good goes up demand goes up.

Question 112. Advertising elasticity of demand is always

  1. Positive
  2. Negative
  3. Constant
  4. All of the above

Answer: 1. Positive

Advertisement elasticity of demand is most of the time positive. Advertisement elasticity is typically positive. Advertisement elasticity varies between zero and infinity.

Question 113. The graph of perfect complimentary goods is:

  1. Straight line
  2. L shaped
  3. U shaped.
  4. None of the above

Answer: 2. L shaped

When goods are perfect compliments consumers consume them in fixed proportions. The indifference curve will consist of straight lines with a right angle bent convex to the origin.

Hence if will be ‘L’ shaped.

Question 114. Which of the following is not an exception to the law of demand?

  1. Giffen goods
  2. Conspicuous goods
  3. White goods
  4. None of the above

Answer: 3. White goods

White goods are heavily priced slow-moving goods.

Examples:  Computers, radios washing machines etc.

Every other good example giffen goods conspicuous goods and speculative goods are exceptions to lav/ of demand.

Question 115. When price increases fewer units are sold which tends to lower the revenue.

  1. Income effect
  2. Price effect
  3. Quantity effect
  4. Substitution effect

Answer: 3. Quantity effect

Quantity effect after a price increase fewer units are sold which tends to lower the revenue.

If the quantity effect which sends to reduces total revenue is the stronger total revenue is reduced.

Question 116. The price of sugar falls from? 10000 to 7 8000 & Quantity decrease from 2500 to 2000 find elasticity of supply

  1. 0
  2. 1
  3. -1
  4.  2

Answer: 2. 1

E(s)= ΔQ / Q × P/ ΔP

= \(\frac{2000}{10000}\) × \(\frac{2500}{500}\)

= 1

Question 117. The law of demand states that the quantity purchased.

  1. Varies Inversely with price.
  2. Varies directly proportional to the price
  3. Varies similar to the price
  4. None of the above

Answer: 1. Varies Inversely with price.

Varies inversely with the price

Reason: The law of demand states that the quantity purchased varies inversely with price. In other words the higher the price the lower the quantity demanded. This occurs because of diminishing marginal utility.

Question 118. If the quantity demanded of mutton increases by 5 % when the price of chicken increases by 25% the price elasticity of demand is –

  1. 0.2
  2. -1
  3. 0
  4. 0.8

Answer: 1. 0.2

Cross Price elasticity is → Demand of good X(%)/ Price of good Y(%)

= (\(\frac{5}{25}\))%

= 0.2

Question 119. A vertical supply. curve parallel to the axis implies that the elasticity of supply is 

  1. Zero
  2. Infinity
  3. More than one 1
  4. Less than one

Answer: 1. Zero

A vertical supply curve parallel to the axis implies that the elasticity of supply is inelastic (highly) and is zero.

No change in demand when price changes

Question 120. If the customer is habitual then elasticity is 

  1. Relative elastic
  2. Negative
  3. Zero
  4. Inelastic

Answer: 4. Inelastic

If a customer has habitual use of a commodity no matter how much its price changes the demand for the commodity will be inelastic. If buyers have preference demand will be inelastic.

Question 121. Consumer surplus is what he is willing to pay less

  1. What he pays
  2. The price of the goods
  3. Money spent on goods
  4. All of the above

Answer: 1. What he pays

Consumer Surplus:

= What the consumer is willing to pay – What he pays.

Question 122. If advertisement is increased by 25% & demand is only increased by 5%. Find advertisement elasticity.

  1. -1
  2. 1
  3. 0.2
  4. -0.2

Answer:  3. 0.2

Advertisement elasticity ⇒ Increase in demand/Advertisement Exp

⇒ (\(\frac{5}{25}\))%

= 0.02

Question 123. When demand decreases due to price increase it is?

  1. Change in demand
  2. Increase in demand
  3. Contraction in demand
  4. Decrease in demand

Answer: 3. Contraction in demand

When demand decreases due to a price increase it is a contraction of demand.

Question 124. If an indifference curve is L-shaped then two goods will be.

  1. Perfect substitute goods.
  2. Substitute goods
  3. Perfect complementary goods
  4. Complementary goods

Answer: 3.  Perfect complementary goods

When two goods are perfect complimentary goods indifference curve will be L-shaped.

Question 125. When the elasticity of supply is infinite, the curve will be: 

  1. Parallel to X-axis
  2. Parallel to Y-axis
  3. Upward sloping
  4. Downward sloping

Answer: 1. Parallel to X-axis

When the elasticity of supply is:

  1. Perfectly elastic (Es = ∞); Curve is parallel to x-axis
  2. Perfectly inelastic (Es = 0): The curve is parallel to the y-axis
  3. Unit elastic (Es = 1): Curve is upward sloping and cuts the –
    origin
  4. Less elastic (0 < Es < 1): The curve is more slopier and cuts the x-axis
  5. Greaver elastic (1 < (Es <∞ ): Curve is more flatter and cuts y-axis

Question 126. Ram and Sons are going for a heavy advertisement campaign to enhance their sales. When analyzed it was realized that the expenditure on advertisement by the company has gone up from ₹ 2,00,000 to 3,00,000 and the sales of this product increased from 10 lakh units to 20 lakh units. What is the advertising elasticity of demand?

  1. -1
  2. 4
  3. 2
  4. 3

Answer: 3.  2

Advertisement elasticity =

Question 127. If the quantity demanded of mutton increases by 5% when the price of chicken increases by 20%, the cross-price elasticity of demand between mutton and chicken is:

  1. 0.25
  2. -4
  3. 4
  4. -0.25

Answer: 1. 0.25

Ed =% Change in quality demanded / % Change in price

= Δ Qd/Q × p/Δ p

= (\(\frac{5}{20}\)) %

= 0.25

Question 128. The household income rises by 20% in a year consequently the demand of TV sets rises by 30% what is the income elasticity of demand?

  1. 1.5
  2. 0.5
  3. 0.4
  4. 5

Answer:1. 1.5

Income elasticity = % Change in quality demanded / % Change in price

= \(\frac{30}{20}\)

= 1.5

Question 129. Which of the following methods calculates the elasticity of demand by using a formula? 

Lower segment of demand Curve / Upper segment of demand curve

  1. They are the elasticity method
  2. Cross elasticity method
  3. The income elasticity method
  4. The point elasticity method

Answer: 4. The point elasticity method

Point elasticity of demand = Lower segment of demand Curve / Upper segment of demand curve

Question 130. When marginal utility is zero then total utility is

  1. Maximum
  2. Lower
  3. Negative
  4. Increasing

Answer: 1. Maximum

Relationship between TU and MU:

  1. TU rises as long as MU is positive, but at a diminishing rate because  MU is diminishing
  2. MU diminishes throughout
  3. When MU = O, TU is maximum it is the satiation point
  4. When MU is negative, TU is diminishing
  5. MU is the rate of change of total utility or it is the slope of TU
    curve
  6. MU can be positive, zero, or negative

Theory Of Demand And Supply Positive And Zero Or Negative

Question 131. The extent to which the demand for a consumer’s good is decreased because others are also consuming the same commodity ‘ refers to:

  1. Bandwagon effect
  2. Snob effect
  3. Veblen effect
  4. None of the above

Answer:  2. Snob effect

By Snob effect, we refer to two extent to which the demand for a consumer’s good is decreased because others are also consuming the same commodity.,

Question 132. Suppose the income elasticity of air conditioners is +1.8, which kind of good is an air conditioner?

  1. Conspicuous goods
  2. Normal good
  3. Inferior good
  4. Superior good

Answer: 2. Normal good

Income elasticity will be positive in the case of normal goods. As Air conditioners are a luxury good and there is no precise definition of ‘ a luxury, but one might expect the income elasticity to be greater than +1.

Question 133. Change in demand due to an increase in the real income of a consumer is called

  1. Income effect
  2. Substitution effect
  3. Marginal effect
  4. Price effect

Answer: 1. Income effect

The increase in demand on account of an increase in real income is known
as income effect.

Question 134. If the price of good X increases, demand for good Y also increases, the two goods are:

  1. Substitutes
  2. Complementary goods
  3. Normal goods
  4. Giffen goods

Answer: 1. Substitutes

Substitute goods are those goods that can be interchangeably used. For example, tea and coffee, ink pen and ball pen. If the price of a product falls the people will try it and thus, the demand for the other product will fall.

Theory Of Demand And Supply Price Coffe And Tea Demond

Question 135. The Delphi technique of demand forecasting is also called

  1. Expert opinion method
  2. Collective opinion method
  3. Controlled experiments
  4. Barometric method

Answer: 1. Expert opinion method

The Delphi technique which is also known as the Expert Opinion method is developed by Olaf Helmer at the Rand Corporation of the USA and provides a useful way to obtain informed judgments from diverse experts by avoiding the disadvantages. conventional panel meeting.

Under his method, instead of depending upon the opinions of buyers and. salesmen, the firm solicits. the opinion of specialists or experts through a series of carefully designed questionnaires. Experts are asked to provide forecasts and reasons for their forecasts

Question 136. Which of the following is not a statistical method of forecasting?

  1. Survey of buyers’ intentions
  2. Regression Analysis
  3. Freehand projection method
  4. Least square method

Answer: 1. Survey of buyers’ intentions

Statistical methods have proved to be very useful in forecasting demand. Forecasting using statistical methods is considered – superior methods because they are more scientific, reliable, and free from subjectivity.

Import statistical methods of forecasting are: 

  1. Trend projection method, which is also known as a classical method, its  popular techniques are
    • Graphical Method, is also known as Freehand.
    • The fitting trend equation is also known as the Least Square Method.
  2. Regression Analysis is the most popular method of forecasting.

Question 137. An indifference curve represents the combination of two commodities which give the consumer:

  1. Equal satisfaction.
  2. Greater satisfaction
  3. Less satisfaction.
  4. No satisfaction

Answer: 1. Equal satisfaction

An indifference curve of two commodities represents that combination which gives consumers Equal Satisfaction.

Question 138. “Which of the following is NOT meant by liberalization?

  1. Decontrol
  2. Disinvestment of PSU’s
  3. Freedom to do business
  4. Deregulation

Answer: 3. Freedom to do business

In an economy, liberalization aims to run a business without any barriers like without having any control, without any regulations. There is no hindrance to doing any business.

Question 139. Which of the following is not an assumption of marginal utility analysis?

  1. Consumer rationality
  2. Cardinal measurability of utility
  3. Ordinal measurability of utility
  4. Continuity in consumption

Answer: 3. Ordinal measurability of utility

Ordinal measurability of utility means that utility can be ranked, which can be possible only in indifference curve analysis and not marginal utility analysis.

Question 140. If the demand of Bajra decreases due to a decrease in its price, then Bajra is a

  1. Superior Good
  2. Inferior Good
  3. Necessity Good
  4. Luxury Good

Answer: 2. Inferior Good

If the price of Bajra decreases, there will be an increase in the real income of consumers which will lead to a decrease in demand for Bajra. Hence, it is an inferior good.

Question 141. There is a decrease in the price of LED TVs after the budget announcement from ₹ 60,000 to ₹ 50,000. As a result to demand for it has increased from 1500 units to 2000 units. The elasticity of demand for LED TV will be:

  1. 1.27
  2. 1.57
  3. 0.63
  4. 0.67

Answer: 2. 1.57

P0=  ₹ 60,000, P1 = ₹  50,000,

∴ ΔP = 50,000 – 60,000 = – 10,000

Q0 = 1500 units, Q1 = 2000 units,

∴ ΔQ = 2,000 -1,500 = 500 units

Elasticity of Demand = Δ Q /Δ P × P1 +P2 / Q1+Q2

= \(\frac{500}{-10000}\) × \(\frac{110000}{3500}\)

= -1.57

= 1.57

Question 142. Price effect is described as which of the following?

  1. Income Effect + Veblen Effect
  2. Substitution Effect + Veblen Effect.
  3. Income Effect + Substitution Effect
  4. Veblen Effect + Demonstration Effect

Answer: 3. Income Effect + Substitution Effect

Income Effect + Substitution Effect

Price Effect = Income Effect + Substitution Effect

Question 143. An increase in the price of pulses leads to an increase in demand for green vegetables

  1. Substitute Goods
  2. Normal Goods
  3. Complimentary Goods
  4. None of the above

Answer: 1. Substitute Goods

There is an increase in the price of pulses which leads to an increase in demand for vegetables. As the price of one good and demand for another good shows a direct relation, so they are substitutes.

Question 144. When two goods are unrelated, then the cross elasticity of demand will be:

  1. 0
  2. 1
  3. (-)1

Answer: 1. 0

When two goods are unrelated to each other, the cross-elasticity of demand
is zero.

Question 145. The rightward shift of the demand curve of coffee represents:

  1. Decrease in Demand
  2. Increase in Demand
  3. Contraction
  4. Expansion

Answer: 2. Increase in Demand

As, there is a rightward shift of the demand curve, there are factors, other
than price (non-price factors) or conditions of demand that might increase the demand for a particular good or service.

Question 146. If the price of a gel pen increases from ₹ 40 to ₹ 150 and in response to this the quantity demand decreases from 25 units to 20 units. The coefficient of price elasticity will be:

  1. .25
  2. -1.25
  3. 0.8.
  4. -0.8

Answer: 4. -0.8

(-)0.8

P0 = ₹ 40, P1 = ₹ 50,

QD0 = 25 units, QD1 = 20 units

ΔP = ΔQD/ΔP × P0/Q0

= \(\frac{-5}{10}{40}{25}\)

= -0.8

Question 147. Suppose there is an increase in income by 15%, which increases demand by 307, the income elasticity of demand will be:

  1. 0.67
  2. 0.5
  3. 2
  4. 1

Answer: 3. 2

ΔD = 30%, ΔI = 15%

Ey =  ΔD/Δl

= (\(\frac{30}{15}\))%

= 2

Question 148. If the indifference curve is ‘L’ shaped then two goods will be called as

  1. Perfect Superior Goods
  2. Perfect Inferior Goods
  3. Perfect Quality Goods
  4. Perfect Complementary Goods

Answer: 4. Perfect Complementary Goods

If the indifference curve is ‘L’-shaped, it means that the marginal rate of substitution (MRS) is undefined because an individual’s preference does not allow any substitution between goods.

Example: Right shoe and left shoe.

Question 149. Who coined the term ‘Demonstration Effect’?

  1. James Duesenberry
  2. Thorstein Veblen
  3. Hicks and Allen
  4. Alfred Marshall

Answer: 1. James Duesenberry

Demonstration effect, a term coined by James Duesenberry refers to the desire of goods to evaluate the consumption behavior of others.

Question 150. Increase or Decrease in supply means:

  1. Shifts in supply curve.
  2. Rightward or leftward shift
  3. Expansion malnutrition
  4. Both (1) and (2)

Answer:  4. Both (1) and (2)

An increase or decrease in supply is due to shifts in the supply curve i.e. rightward or leftward shift which occurs due to changes in non¬price factors. ‘

Question 151. Which of the following is not an exception to the law of Demand?

  1. Speculative Goods
  2. Giffen Goods
  3. Necessity Goods
  4. Normal Goods

Answer: 4. Normal Goods

Normal Goods are in agreement with the Law of Demand. So, there are no exceptions to the law of Demand.

Question 152. Movement along the same Demand curve represents.

  1. Change in Demand
  2. Change in Quantity Demand
  3. Increase in Demand.
  4. Decrease in Demand

Answer: 2. Change in Quantity Demand

Movement along the source demand curve is due to price changes which leads to changes in the quantity demanded.

Question 153. An increase in the price of pulses leads to an increase in demand for green vegetables:

  1. Substitutes
  2. Complimentary Goods
  3. Normal Goods
  4. None of the above

Answer: 1. Substitutes

An increase in the price of pulses leads to a decrease in demand for pulses and an increase in demand for green vegetables.

Question 154. When the number of tourists increases at a place for which room rent of a hostel also increases. Then the electricity of supply of room will be:

  1. Zero
  2. < 1
  3. >1
  4. = 1

Answer: 2. < 1.

There is an increase in several tourists and even though there is an increase in hotel room prices, the supplier cannot be able to expand the supply with the same proportionate. So, the elasticity of supply will be less than one that is inelastic supply.

Question 155. When oranges have (-)0.58 Increase elasticity, the commodity orange is called:

  1. Orange is a Necessity Good
  2. Orange is an inferior Good
  3. Orange is a Substitute Good
  4. None

Answer: 2. Orange is an Inferior Good.

If Income elasticity has a negative value, then good is said to be ‘ Inferior Good.

Question 156. Which of the following methods is used to calculate Elasticity of Demand, when price and quantity demand are large?

  1. Zero Elasticity
  2. Cross Elasticity
  3. Point Elasticity
  4. Are Elasticity

Answer: 4. Are Elasticity

Are Elasticity is used to calculate the elasticity of demand when price and quantity demand, have large changes.

Question 157.  Suppose that total utility is 100 at 10 units of consumption of a commodity. If the consumer increases the consumption by one more unit, the total utility increases to 108. The marginal utility of the last units consumed will be: 

  1. 8
  2. 100
  3. 108
  4. 101

Answer: 1. 8

TU10 = 100, TU11 = 108.

MUn = TUn-TUn-1

MU11 = TU11– TU10 = 108- 100

= 8

Question 158.  Due to the introduction of 5G mobiles in the market, the price of such mobiles has increased by 20% and thereby supply increased by 40%, the, elasticity of supply will be which of the following?

  1. 0.5
  2. (-)0.5
  3. -2
  4. 2

Answer: 4. 2

% . ΔQS = 40%, %. ΔP = 20%

Es = % ΔQS / %  ΔP

=  (\(\frac{40}{20}\))%

= 2

Question 159. Demand for a commodity refers to:

  1. A desire for the commodity ‘
  2. Need for the commodity
  3. Quantity demanded of that commodity
  4. Quantity of the commodity demanded at a certain price during any particular period.

Answer: 4. Quantity of the commodity demanded at a certain price during any particular period.

Question 160. Suppose the price of movies seen at a theatre rises from ? 120 per person to 200 per person. The theatre manager observed that the rise in prices has led to a fall in attendance at a given movie from 300 persons to 200 persons. What is the price elasticity of demand for the movie?.

  1. 0.5
  2. 0.8
  3. 1.00
  4. None of these.

Answer: 2. 0.8

Question 161. In the case of an inferior good, the income elasticity of demand is :

  1. Positive
  2. Zero
  3. Negative
  4. Infinite

Answer: 3. Negative

Question 162. For what type of goods does demand to fall with a rise in the income levels of households?

  1. Inferior goods
  2. Substitutes
  3. Luxuries
  4. Necessities

Answer: 1. Inferior goods

Question 163. In the case of Inferior goods like bajra, a fall in its price tends to :

  1. Make the demand remain constant
  2. Reduce the demand
  3. Increase the demand
  4. Change the demand in an abnormal way

Answer: 2. Increase the demand

Question 164. Movement along the same demand curve shows:

  1. Expansion of demand
  2. Expansion of supply
  3. Expansion and contraction of demand
  4. Increase and decrease in demand

Answer: 3. Expansion and contraction of demand

Question 165. The price of hot dogs increases by 22% and the quantity demanded falls by 25% this indicates that demand for hot dogs is :

  1. Elastic
  2. Inelastic
  3. Unitary elastic
  4. Perfectly elastic

Answer: 1. Elastic

Question 166. The quantity demanded does not respond to price change and so the elasticity is:

  1. Zero
  2. One
  3. Infinite
  4. None

Answer: 1. Zero

Question 167. What is an Engels curve?

  1. Another name for the demand curve
  2. A curve showing both demand & supply curves
  3. Curve named after Lord Engels
  4. All

Answer: 2. A curve showing both demand & supply curves

Question 168. Which factor generally keeps the price-elasticity of demand for a good low:

  1. Variety of uses for those goods
  2. Its low price
  3. Close substitutes for those goods
  4. A high proportion of the consumer’s income spent on it

Answer: 2. Its low price

Question 169.  In case of a straight-line demand curve meeting the two axes, the price elasticity of demand at the mid-point of the line would be

  1. 0
  2. 1
  3. 1.5
  4. 2

Answer: 2. 1

Question 170. An increase in demand can result from: 

  1. A decline in the market price
  2. An increase in income
  3. A reduction in the price of substitutes
  4. An increase in the price of complements

Answer: 2. An increase in income

Question 171. Compute income elasticity if demand increases by 5% and income by 1%

  1. 5
  2. 1/5
  3. 0
  4. None

Answer: 1.5

Question 172. For a commodity with a unitary elastic demand curve if the price of the commodity rises, then the consumer’s total expenditure on this commodity  would :

  1. Increase
  2. Decrease
  3. Remains constant
  4. Either increase or decrease

Answer: 3. Remains constant

Question 173. What is the value of elasticity of demand if the demand for the goods is perfectly elastic?

  1. 0
  2. 1
  3. Infinity
  4. Less than 0

Answer: 3. Infinity

Question 174. What is the original price of a commodity when price elasticity is 0.71 demand changes from 20 units to 15 units and the new price is? 10? Point elasticity.

  1. 15.4
  2. 18
  3. 20
  4. 8

Answer: 1. 15.4

Question 175. If the price of a complementary good rises 

  1. The demand curve shifts to the left ’
  2. Demand curve shifts to the right
  3. The demand curve moves downwards
  4. The demand curve moves upwards

Answer: 1. Demand curve shifts to the left

Question 176. Cross elasticity of demand in the Monopoly market is

  1. Elastic
  2. Zero
  3. Infinite
  4. One

Answer: 2. Zero

Question 177. What is the income elasticity of demand, when income changes by 20% and demand changes by 40%

  1. 1/2
  2. 2
  3. 0.33
  4. None

Answer: 2. 2

Question 178. If demand is parallel to the X-axis, what will be the nature of elasticity?

  1. Perfectly elastic
  2. Inelastic
  3. Elastic
  4. Highly elastic

Answer: 1. Perfectly elastic

Question 179. Giffen Paradox is an exception of

  1. Demand
  2. Supply
  3. Production
  4. Utility

Answer: 1. Demand

Question 180. The law of demand is a

  1. Quantitative statement
  2. Qualitative statement
  3. Both (1)
  4. Hypothetical

Answer: 2. Qualitative statement

Question 181. The demand for which type of goods do not decrease with the increase in its price

  1. Comforts
  2. Luxury
  3. Necessities
  4. Capital goods

Answer: 3. Necessities

Question 182. Increase in Price from? 4 to ? 6 then a decrease in demand from 15 units to 10 units. What is the price elasticity?

  1. 0.66
  2. 5
  3. -1.5
  4. 2

Answer: 1. 0.66

Question 183. Expansion & contraction of the demand curve occurs due to:

  1. Change in the price of a commodity
  2. Change in price of substitute or complementary goods
  3. Change in income
  4. None

Answer: 1. Change in the price of a commodity

Question 184. The elasticity between two points

  1. Point elasticity
  2. Arc elasticity
  3. Cross elasticity
  4. None

Answer: 2. Arc elasticity

Question 185. When price remains constant and quantity demanded changes, then the elasticity of demand will be

  1. Vertical to X-axis
  2. Horizontal to X-axis.
  3. Either or
  4. None

Answer: 2. Horizontal to X-axis.

Question 186. The demand of a commodity depends upon

  1. Price
  2. Income
  3. Price of related goods
  4. All of the above

Answer: 4. All of the above

Question 187. In the case of substitute goods, cross elasticity is.

  1. Negative
  2. Zero
  3. Positive
  4. None of these

Answer: 3. Positive

Question 188. The prices of a commodity were increased from ? 4 to ? 6. As a result, demand decreased from 15 units to 10 units. What is the price elasticity?

  1. 0.66
  2. 0.33
  3. 1.00
  4. 1.5

Answer: 1. 0.66

Question 189. Other things remain constant, if the price of the inferior goods decreases then what will be the effect?

  1. Demand, Increases
  2. Demand, Increases
  3. Quantity demanded increases
  4. Quantity demand decreases.

Answer: 4. Quantity demand decreases.

Question 190. When does the price fall? 6 to ? 4, the demand rises from. 10 to 15 units. Calculate the price elasticity of demand.

  1. 1.5
  2. 3.5
  3. 0.5
  4. 2

Answer: 1. 1.5

Question 191. The cross-elasticity of perfect substitutes is

  1. Zero
  2. Negative
  3. One
  4. Infinity

Answer: 4. Infinity

Question 192. What is Engel’s Curve?

  1. The curve showing three demand curve
  2. Named after Ernst Engel ‘
  3. Both (1) and (2)
  4. None

Answer: 3. Both (1) and (2)

Question 193. A consumer spends? 80 on purchasing a commodity when its price is ₹ per unit and spends ₹96 when the price is ₹ 2 per unit. Calculate the price elasticity of demand.

  1. 0.2
  2. 0.3
  3. 0.4
  4. 0.5

Answer: 3.  0.4

Question 194. When the price of a cylinder rises ₹120 to ₹ 200, the demand falls from 300 to 200. Calculate the price elasticity of demand.

  1. 1.00
  2. 0.50
  3. 5.00
  4. None

Answer:  2. 0.50

Question 195. If the price is decreased from ₹10 to ₹8 of a commodity but the quantity demanded remains the same as price elasticity is.

  1. 1
  2. 0
  3. 8
  4. None

Answer:  2. 0

Question 196. Demand for electricity power is elastic because.

  1. It is available at a very high price
  2. It is essential for life
  3. It has many uses
  4. It has many substitutes

Answer: 3. It has many uses

Question 197. If the income of a person increases by 10% and his demand for goods increases by 30%, income elasticity will be.

  1. Equal to one
  2. Less than one
  3. More than one
  4. None of these

Answer: 3. More than one

Question 198. In the case of luxury goods, the income elasticity of demand will be

  1. Zero
  2. Negative but greater than one
  3. Positive but greater than one
  4. Positive but less than one

Answer: 3. Positive but greater than one

Question 199.  In the case of a straight-line demand curve meeting two axes, the price elasticity of demand at the point where the curve meets y-axis would be.

  1. Zero
  2. Greater than one
  3. Less than one
  4. Infinity

Answer: 4. Infinity

Question 200. Calculate income elasticity for the household when the income of the household increases by 10% and the demand for cars rises by  20%.

  1. +2
  2. -2
  3. +5
  4. -5

Answer: 1. +2

Question 201. The commodity whose demand is associated with the name of Sir Robert Giffen?

  1. Necessary good
  2. Luxury good
  3. Inferior good
  4. Ordinary good

Answer: 3. Inferior good

Question 202. In expansion and contraction of demand.

  1. Demand curve
  2. Remains unchanged.
  3. Demand curve changes
  4. The slope of the demand curve changes

Answer: 4. Both (1) & (3) above

Question 203. Certain goods for which Quantity demanded decreases when Income Increases are called

  1. Superior goods
  2. Inferior goods
  3. Prestige goods
  4. Conspicuous goods

Answer: 2. Inferior goods

Question 204. When the price falls by 5% and the demand in rises by 6%, then elasticity of demand is

  1. Elastic
  2. Inelastic
  3. Unitary elastic
  4. Zero

Answer: 1. Elastic

Question 205. The cross-elasticity of complementary goods is 

  1. Positive
  2. Negative
  3. Infinity
  4. None of these.

Answer: 2. Negative

Question 206. The demand for i-pod increases from 950 to 980 and income increases from ‘ 9,000 to 9,800. What is income elasticity?

  1. 0.53
  2. 0.35
  3. 0.43
  4. None

Answer: 2. 0.35

Question 207. Contraction of demand results due to.

  1. Increase in the price of the goods
  2. Decrease in the no. of the producers
  3. Decrease in the output of the sellers
  4. Decrease in the price of the goods.

Answer: 1. Increase in the price of the goods

Question 208. Bricks for houses is an example of which kind of demand?

  1. Composite
  2. Competitive
  3. Joint
  4. Derived.

Answer: 4. Derived.

Question 209.  Normal goods have.

  1. Zero income elasticity
  2. Negative income elasticity
  3. Positive income elasticity
  4. Infinite income elasticity

Answer: 3. Zero income elasticity

Question 210. In which of the following cases the demand for goods tends to be less elastic?

  1. Good is necessary
  2. The period is shorter
  3. The number of close substitutes is less
  4. All of the above

Answer: 4. All of the above

Question 211. Which of the following elasticity of demand measures a movement along the demand curve rather than a shift in the curve?

  1. Income elasticity of demand
  2. Price elasticity of demand
  3. Substitution elasticity of demand.
  4. None of these.

Answer: 2. Price elasticity of demand

Question 212. If the price elasticity of demand is zero, the shape of the curve will be

  1. Horizontal
  2. Vertical
  3. Sloping downwards
  4. None of these.

Answer: 2. Vertical

Question 213. If a 20% fall in the price of a commodity brings about a 40% increase in its demand, then the demand for the commodity will be termed as:

  1. Inelastic
  2. Elastic
  3. Highly elastic
  4. Perfectly elastic

Answer: 2. Elastic

Question 214. Expansion and contraction in demand are caused by

  1. Change in the income of the buyer
  2. Change in the taste and preference of the buyer
  3. Change in the price of the commodity
  4. Change in the price of the related goods.

Answer: 3. Change in the price of the commodity

Question 215. A fall in the price of normal goods leads to

  1. A shift in the demand curve
  2. Fall in demand
  3. A rise in consumers’ real income
  4. A fall in consumers’ real income.

Answer: 3. A rise in consumers’ real income

Question 216. A 10% increase in the price of tea results is an 8% increase in the demand for coffee. Cross elasticity of demand will be 

  1. 0.80
  2. 1.25
  3. 1.50
  4. 1.80

Answer: 1. 0.80

Question 217. When the total expenditure incurred by the consumers on a commodity due to a change is its price remains the same, then the elasticity of  demand for that commodity will be

  1. Zero
  2. One
  3. More than one
  4. Less than one

Answer: 2. One

Question 218. What will be the price elasticity if the original price is ₹ 5, the original quantity is 8 units and the changed price is ₹ 6, and the changed quantity is 4 units

  1. 2.5
  2. 2.0
  3. 1.5
  4. 1.0

Answer: 1. 2.5

Question 219. The original price of a commodity is ₹ 500 and the quantity demanded of that is 20 kgs. If the price rises to ₹ 750 and the quantity demanded falls to 15 kgs. The price elasticity of demand will be:

  1. 0.25
  2. 0.50
  3. 1.00
  4. 1.50

Answer: 2. 0.50

Question 220. The demand for factors of production is

  1. Fundamental demand
  2. Derived demand
  3. Market demand
  4. Joint demand.

Answer: 2. Derived demand

Question 221. Cross elasticity of demand between two perfect  substitutes will be

  1. Very high
  2. Very low
  3. Infinity
  4. Zero

Answer: 3. Infinity

Question 222. What is the elasticity between the midpoint and the upper extreme point of a straight-line continuous demand curve?

  1. Infinite
  2. Zero
  3. Greater than one
  4. Less than one

Answer: 3. Greater than one

Question 223. The price of a Tiffin Box is ₹ 100 per unit and the quantity demanded in the market is 1,25,000 units. The company increased the price to ₹ 125. Due to this price increase, the quantity demanded decreased to 1,00,000 units. What will be the price elasticity of demand?

  1. 1.25
  2. 0.80
  3. 1.00
  4. None of the above.

Answer: 2. 0.80

Question 224. The price of a commodity decreases from 10 to 8 and the quantity demanded of it increases from 25 to 30 units, then the coefficient of  price elasticity will be 

  1. 1.00
  2. -1.00
  3. 1.5
  4. -1.5

Answer: 2. -1.00

Question 225. Which statement is true about the law of demand?

  1. Income rises, demand rises
  2. Price rises, demand rises
  3. Price falls, demand falls
  4. Price falls, demand rises

Answer: 4. Price rises, demand rises

Question 226. Which of the following is not a determinant of demand?

  1. Consumer’s tastes and preferences
  2. Quality supplied of a commodity
  3. The income of the consumers
  4. Price of related goods

Answer: 2. Quality supplied of a commodity

Question 227. A demand curve parallel to the Y-axis implies:

  1. Ep = 0
  2. Ep = 1
  3. Ep < 1
  4. Ep > 1

Answer: 1. Ep = 0

Question 228. Generally, when the. income of a consumer increases, he goes in for superior goods, leading to a fall in the demand for inferior goods. It means, income elasticity of demand for superior goods.

  1. Less than
  2. Unitary
  3. Zero
  4. Negative

Answer: 1. Less than

Question 229. If the quantity demanded of X commodity increases by 5% when the price of Y commodity increases by 20%, the cross-price elasticity of demand between X and Y commodity will be

  1. -0.25
  2. 0.25
  3. -4.00
  4. 4.00

Answer:  2. 0.25

Question 230. Which of the following is the right formula for calculating the price elasticity of demand using the ratio method?

  1. (AQ/AP) x (P/Q)
  2. (AP/AQ) x (Q/P)
  3. (AQ/AP) x (Q/P)
  4. AP/AQ) x (1/P)

Answer: 1. (AQ/AP) x (P/Q)

Question 231. A straight line demand curve at the point of meeting the x-axis will indicate the elasticity coefficient Equal to.

  1. One
  2. Infinity
  3. Zero
  4. More than one

Answer: 3. Zero

Question 232. Changes in the quantity demanded in response to changes in the price of the same commodity are called:

  1. Change in demand
  2. Change in quantity demanded
  3. Income demand
  4. Cross demand

Answer: 2. Change in quantity demanded

Question 233. Otherthings being equal, a fall in the price of the complementary goods will cause the of the other to rise.

  1. Price
  2. Supply
  3. Demand
  4. Utility

Answer: 3. Demand

Question 234. A horizontal demand curve parallel to the X-axis shows that the elasticity of demand is:

  1. Zero
  2. Equal to unity
  3. Greater than unity
  4. Infinite.

Answer: 4. Greater than unity

Question 235. When the price of a commodity increases from  8 to ? 9, its demand decreases by 10%. The price elasticity of demand for the  commodity is:

  1. 0.8
  2. 0.9
  3. 1.0
  4. 1.1

Answer: 1. 0.8

Question 236. Which one of the following is correct about the price elasticity of demand for a commodity?

  1. It remains the same in all situations
  2. It has several degrees/nature
  3. It remains unaffected by the price of any other commodity
  4. It is an immeasurable concept.

Answer:  3. It has several degrees/nature

Question 237. The supply of a good refers to :

  1. Actual production of goods.
  2. Total stock of goods
  3. Stock available for sale
  4. Amount of goods offered for sale at a particular price per unit of time

Answer: 4. Amount of goods offered for sale at a particular price per unit of time

Question 238. Increase or Decrease in Supply means

  1. A shift in Supply cost
  2. Movement along the same supply curve
  3. Both (1) and (2)
  4. Neither (1) or (2)

Answer: 1. A shift in Supply cost

Question 239. If the supply curve is Perfectly Inelastic, the supply curve is:

  1. Vertical
  2. Horizontal
  3. Upward sloping
  4. Downward sloping

Answer: 1. Vertical

Question 240. When the supply price increases in the short run, the profit of the producer

  1. Increases
  2. Decreases
  3. Remains constant
  4. Decreases marginally

Answer: 1. Increases

Question 241. A change in the supply of a commodity along with the same supply curve may occur due to

  1. Change in the price of the commodity
  2. Change in the prices of related goods
  3. Change in future expectations about the price of the goods
  4. Change in the cost of inputs

Answer:  1. Change in the price of the commodity

Question 242. What is the elasticity of supply, when the price changes from ₹15 to ₹12 and supply change from 6 units to 5 units?

  1. 0.77
  2. 0.87
  3. 0.833
  4. 0.58

Answer: 3. 0.833

Question 243. A perfectly inelastic supply curve will be

  1. Parallel to X-axis
  2. Parallel to Y-axis
  3. Downward sloping
  4. None of these

Answer: 2. Parallel to Y-axis

Question 244. If the supply of a commodity is perfectly elastic, an increase in demand will result in

  1. Decrease in both the price and quantity at equilibrium
  2. Increase in both the price and quantity at equilibrium
  3. Increase in equilibrium quantity, equilibrium price remaining constant
  4. Increase in equilibrium price, the equilibrium quantity remaining constant

Answer: 3. Increase in both the price and quantity at equilibrium

Question 245. When the change in the quantity supplied is proportionate to the Change in the price, the producer is said to have :

  1. Perfectly elastic supply „
  2. Relatively elastic supply
  3. Unitary elastic supply
  4. Perfectly inelastic supply.

Answer: 3. Unitary elastic supply

Question 246. Expansion in supply refers to a situation when the producers are willing to supply a

  1. A larger quantity of the commodity at an increased price
  2. Larger quantity of the commodity due to increased taxation on that commodity
  3. A larger quantity of the commodity at the same price
  4. A larger quantity of the commodity at a decreased price

Answer: 1. Larger quantity of the commodity at an increased price

Question 247. When the supply is perfectly inelastic, the elasticity of supply is equal to

  1. +1
  2. 0
  3. 1
  4. Infinity

Answer: 2. 0

Question 248. If there is an improvement in the technology, 

  1. The supply curve shifts to the left
  2. The supply curve shifts to the right
  3. Quantity supplied increase
  4. Both (2) and(3)

Answer: 2. The supply curve shifts to the right

Question 249. If the price of apples rises from ₹ 30 per Kg to ₹ 40 per Kg and the supply increases from- 240 Kg to 300 Kg. Elasticity of supply is 

  1. 0.75
  2. 0.67
  3. 00.67
  4. 00.77

Answer: 1. 0.75

Question 250. A horizontal supply curve parallel to the quantity axis implies that the elasticity of supply is :

  1. Zero
  2. Infinite
  3. Equal to one
  4. Greater zero but less than one

Answer: 2. Infinite

Question 251. Supply refers to the quantity supplied at a particular price for a particular period:

  1. True
  2. False
  3. Partly true
  4. None

Answer: 1. True

Question 252. An increase or decrease in supply means a change in supply due to a change in its price

  1. Change in supply
  2. Due to changes in factors other than its price
  3. Both the above
  4. None of the above

Answer: 2. Change in supply

Question 253. When the Supply Curve shifts to the right there is in Supply.

  1. An increase
  2. Expansion
  3. Contraction
  4. Decrease.

Answer: 1. An increase

Question 254. The elasticity of supply is defined as the responsiveness of quantity applied of a good to a change in the.

  1. Price of concerned good
  2. The price of a substitute good
  3. Demand
  4. None.

Answer: 1. Price of concerned good

Question 255. The supply of the commodity imply?

  1. Total Output during a specified period
  2. Its total stock
  3. It’s stock available for sale
  4. Its Quantity Offered for sale at a particular price per unit of time

Answer: 4. Its Quantity Offered for sale at a particular price per unit of time

Question 256. Supply of a commodity is a

  1. Stock concept
  2. Flow concept
  3. Both stock and flow concept
  4. Wholesale concept

Answer: 2. Flow concept

Question 257. The price of mangoes increases from ₹ 30 per kilogram to ₹ 40 per kilogram and the supply increases from 240 kilograms the 300, kilograms. What will be the elasticity of supply for mangoes?

  1. -0.67
  2. +0.67
  3. – 0.77
  4. +0.75

Answer: 4. +0.75

Question 258. If a 20% fall in price brings about a 10% fall in quantity supplied, in such a case elasticity of supply will be equal to

  1. 2.0
  2. 0.5
  3. 1.0
  4. 1.5

Answer: 2. 0.5

Question 259. At a price of ₹ 25 per kg, the supply of a commodity is 10,000 kg per week. An increase in its price to ₹ 30 per kg, increases the supply of the commodity to 12,000 kg per week. The elasticity of supply will be:

  1. 0.75
  2. 1.00
  3. 1.50
  4. 1.75

Answer: 2. 1.00

Question 260. Short-run price is also called by the name of.

  1. Market price
  2. Showroom price
  3. Maximum retail price –
  4. None of these.

Answer: 1. Market price

Question 261. If a 20% fall in the price brings about a 10% fall in the quantity supplied, then the elasticity of supply will be equal to:

  1. 2.0
  2. 0.5
  3. 1.0
  4. 1.5

Answer: 2. 0.5

Question 262. The elasticity of supply is greater than one when:

  1. A proportionate change in price is more than a proportionate change in
    quantity supplied
  2. The proportionate change in quantity supplied is more than the proportionate
    change in price
  3. Change in price and quantity supplied are equal ’.
  4. All of the above

Answer: 2. Proportionate change in quantity supplied is more than the proportionate change in price

Question 263. Supply refers to which of the following? 

  1. Total stock of the goods
  2. Stock of the goods available for sale
  3. Quantity of a good offered for sale at a particular price
  4. Quantity of a good sold

Answer: 3. Quantity of a good offered for sale at a particular price

Question 264. After reaching saturation point consumption of additional units of commodity causes

  1. Total utility to fall and marginal utility to increase
  2. Total and marginal utility both to increase
  3. Total utility to fall and marginal utility to become negative
  4. Total utility to become negative and marginal utility to fall

Answer: 3. Total utility to fall and marginal utility to become negative

Question 265. The elasticity of supply is greater than one When the Proportionate change in price is greater than the proportionate

  1. Change in quantity supplied
  2. The proportionate change in quantity supplied is more than the  proportionate   change in price
  3. Changes in price and quantity supplied are equal
  4. All of the above

Answer: 2. A Proportionate change in quantity supplied is more than the  proportionate   change in price

Question 266. As the price of a commodity increases, normally, its  supply

  1. Decreases
  2. Remains unchanged
  3. Increases
  4. Cannot be determined.

Answer: 3. Remains unchanged

Question 267. If equilibrium is present in a market then it can be said that

  1. The price of the product will tend to rise
  2. Quantity demanded equals quantity supplied
  3. Quantity demanded exceeds quantity supplied
  4. Quantity supplied exceeds quantity demanded

Answer: 2. Quantity demanded equals quantity supplied

Question 268. Supply is a concept.

  1. Flow
  2. Stock
  3. Flow and stock, both
  4. Qualitative

Answer: 1. Flow

Question 269. The elasticity of supply is measured by dividing the percentage change in Quantity supplied of goods by: 

  1. Percentage change in income
  2. Percentage change in price
  3. Percentage change in quantity demanded of goods
  4. Percentage change in taste preferences

Answer: 2. Percentage change in price

Question 270. An increase in supply denotes a shift in the supply curve to the right. If there is an increase in supply without a change in demand the equilibrium price will and the quantity demanded will go up.

  1. Fall
  2. Remain constant
  3. Increase
  4. Becomes zero.

Answer: 1. Fall

Question 271. Which among the following is not a determinant of supply?

  1. The price of the commodity concerned
  2. Prices of the factors of production
  3. State of technology used in the production process
  4. Customs and traditions in society

Answer: 4. Customs and traditions in society

Question 272. When the price of the commodity increases from ₹ 200 per unit to ₹ 250 per unit and consequently the quantity supplied rises from 1000 units to 1100 units. What will be the coefficient of elasticity of supply?

  1. 4.0
  2. 0.4
  3. 5.0
  4. 0.5

Answer: 2. 0.4

Question 273. The Supply Curve shifts to the right because of

  1. Improved technology
  2. Increased price of factors of production
  3. Increased excise duty
  4. All of the above.

Answer: 1. Improved technology

Question 274. The supply of a good refers to

  1. Stock available for sale
  2. Total stock in the warehouse
  3. Actual production of the goods
  4. Quantity of the good offered for sale at a particular price per unit of time

Answer: 4. Quantity of the good offered for sale at a particular price per unit of time

CA Foundation Economics – Theory Of Cost Multiple Choice Questions

CA Foundation Economics – Theory Of Production And Cost  Multiple Choice Questions

Question 1. Opportunity cost is

  1. Direct cost
  2. Total cost
  3. Cost of foregone oppurtunity
  4. Accounting cost

Answer: 4. Cost of foregone opportunity

Opportunity cost is the cost of the next best alternative forgone. It’s the cost of foregone opportunity.

Question 2. As output increases, the average fixed cost

  1. Remains constant
  2. Starts falling
  3. Start rising
  4. None

Answer: 2. Starts falling

The average fixed cost is expressed as 

AFC = Fixed Cost/ Number of units produced

Fixed cost always remains fixed. It does not increase with an increase in output. So the average fixed cost falls as more and more units are produced as the fixed cost remains the same.

Question 3. Average fixed cost can be obtained through 

  1. AFC = TFC/TS
  2. AFC = EC/TU
  3. AFC = TC/ PC
  4. AFC = TFC/TU

Answer: 4. AFC = TFC/TU

Average Fixed Cost = Total Fixed Cost / Number of units produced

In the given Question

AFC  = Average fixed cost

TFC =  Total Fixed cost

TU =  Total no. of units produced.

Question 4. AFC curve Is

  1. Convex & downward sloping
  2. Conenvo & downward sloping
  3. Convox & upward sloping
  4. Conenvo & upward rising

Answer: 1. Convex & downward sloping

Average fixed cost always decreases with an Incroaso in output so the AFC curve Is convex and downward sloping.

Question 5. A firm’s average flood cost Is 20 at 6 units of output what will It be at 4 units of output?

  1. 60
  2. 30
  3. 40
  4. 20

Answer:  2. 60

TFC/ Number of units

20 = TFC/6

So Total fixed cost = 20 × 6

= ₹ 120.

So Average Fixed Cost of 4 units of output

AFC = TFC / Number of units

AFC = \(\frac{120}{4}\).

= 30

Question 6. U-shaped average cost curve is based on:

  1. Law of Increasing Cost
  2. Law of decreasing cost
  3. Law of constant rot urns to scale
  4. Law of variable proportions

Answer: 4. Law of variable proportions

Avorago cost curve is U-shaped due to the law of variable proportion. In the the first stage, T.P increases so AC decreases, then T.P becomes constant and finally, T.P decreases and AC increases. Horico, it gives a U shape to the average cost curve

Theory Of Production And Cost Average Cost Curve Is U Shaped

Question 7. When the shape of the average cost curve is upward, the marginal cost

  1. Must be decreasing
  2. Must be constant
  3. Must be rising
  4. Any of these

Answer: 3. Must be rising

Average cost and marginal cost are so related that when the average cost falls, MC falls at a faster rate, when AC rises, MC cuts AC at its minimum.

So when the AC curve is upward MC must be rising.

Question 8. If the total cost for 10 units is ₹ 600 and ₹ 640 for the 11th unit. The marginal cost of the 11th unit is 

  1. ₹20
  2. ₹30
  3. ₹40
  4. ₹50

Answer:  3.

Marginal Cost = TC – TC

= TC11– TC11-1

= 640 -600

= ₹ 40

Question 9. Economic cost excludes which of the following 

  1. Accounting cost + explicit cost
  2. Accounting cost + implicit cost
  3. Explicit cost + Implicit cost
  4. Accounting cost + opportunity cost

Answer: 1.  Accounting cost + explicit cost

Economics cost takes into account accounting (explicit) cost and in addition to this includes the amount of money the entrepreneur could have earned if he had invested his money and sold his se-does arc ether factors in the next best alternative use.

Economic Cost = Implicit cost e Explicit cost

OR = Accounting cost + Implicit cost

OR = Accounting cost e opportunity cost

Question 10. Which of the following cost curves is never ‘U’ shaped?

  1. Average total cost curve
  2. Marginal cost curve
  3. Total cost curve
  4. Total Fixed cost curve

Answer: 4. Total Fixed cost curve

Total fixed cost refers to the cost which remains the same even if the total increases. Rxed cost has no effect with an increase and decrease h production. Examples of such costs are rent factory charges, etc. Since fixed cost always remains constant so the fixed cost curve is not  U shaped but it’s a straight

Theory Of Production And Cost Cost Curves Is Never U Shaped

Question 11. Suppose, the total cost of production of commodity X is ₹ 1,25,000. Out of this cost, the implicit cost is ₹ 35,000 and the normal profit is ₹ 25,000. What will be the explicit cost of commodity X?

  1. 90,000
  2. 65,000
  3. 60,000
  4. 1,00,000

Answer: 2.  65,000

Total cost = ₹ 1,25,000

Implicit cost =₹ 35,000

Normal profit = ₹ 25,000 –

Explicit cost =?

Total cost = Explicit Cost + Implicit Cost + Normal Profit

1,25,000 = Explicit Cost + 35,000 + 25,000

Explicit Cost = ₹ 65,000

Question 12. What is the total cost of production of 20 units, if the fixed cost is X 5,000 and the variable cost is ₹ 2/-?

  1. 5,400
  2. 5,040
  3. 4,960
  4. 5,020

Answer: 2. 5,040

Total Cost = Fixed Cost + Variable Cost t

₹ 5,000 ÷ 20 × 2.

= ₹ 5040

Question 13. External economies accrue due to _________________

  1. Increasing returns to scale
  2. Increasing returns to factor
  3. Law of variable proportion
  4. Low cost

Answer: 1. Increasing returns to scale

External economies accrue to firms as a result of the expansion of the output of the whole industry. Increasing returns to scale occur due to external economies.

Question 14. At which point does the marginal cost curve intersect the average variable cost curve and short-run average total cost curve?

  1. At equilibrium points
  2. At their lowest points
  3. At their optimum points
  4. They don’t intersect at all

Answer: 2. At their lowest points

The marginal cost curve and average cost curve tend that when the AC curve falls, the MC curve falls faster when the AC curve rises MC curve rises at a faster rate and the MC curve cut the AC curve at its minimum .(lowest point).

Theory Of Production And Cost AVC And AC Curves Are U shaped

Question 15. Implicit cost may be defined as the

  1. Costs which do not change over some time
  2. Costs which the firm incurs but doesn’t disclose
  3. Payment to the non-owners of the firm for the resources
  4. Money payment which the self-employed resources could have earned in their best alternative employment

Answer: 4. Implicit cost is the cost of self-employed resources.

It is the cost of inputs owned by the firms and used by the firm in its production process.

Implicit costs include:

  • Return on money invested by the entrepreneur in .its own business
  • Rent of self-owned building of the entrepreneur.

Question 16. A firm’s average fixed cost is ^ 40 at 12 units. What will be the average fixed cost at 8 units:

  1. ₹ 60
  2. ₹ 70
  3. ₹ 90
  4. ₹ 80

Answer: 1. ₹ 60

AFC = TFC/Number of units produced

40 = TFC/12

TFC = 40 × 12

= ₹ 480

Question 17. Returns to scale will said to be in operation when the quantity of

  1. All inputs are changed
  2. All inputs are changed in already established proportion
  3. all inputs are not changed
  4. One input is changed while the quantity of all other inputs remains the same

Answer:  2. All inputs are changed in already established proportion

Returns to scale come into operation when all inputs whether fixed or variable are changed in the same proportion i.e. the scale of production changes.

Question 18. Which of the following curves never touches any axis but is downward?

  1. Marginal cost curve
  2. Total cost curve
  3. Average fixed cost curve
  4. Average variable cost curve

Answer: 3. Average fixed cost curve

The average fixed cost curve never touches any axes but it slopes downward. Average fixed cost can never be zero even if there is no production so it can never touch any axes. AFC falls when output increases as fixed cost is always fixed. Hence, the curve is downward sloping.

Question 19. Which of the following is known as the Envelope curve?

  1. MC curve
  2. AFC curve
  3. LAC curve
  4. TFC curve

Answer: 3. LAC curve

The long-run average cost curve is called the enveloping curve os ft envelops all short-run average cost curves (SAC curves are tangent to the LAC curve)

Theory Of Production And Cost Lung ru Average Cost Curve Is Enveloping Curve

Question 20. A firm producing 7 units of output has an average total cost of ₹ 150 and has to pay ₹ 350 to its fixed factors of production How much of the average lotal cost is made up of variable cost?

  1. 200
  2. 50
  3. 300
  4. 100

Answer: 4. 100

ATC = TC / Number of units

150= T.C/7

Total cost of 7 units = 150 × 7 = 1050

Fixed Cost = 7 350

Total cost = Fixed Cost + Variable Cost

1050 = 350 + V.C.

So variable cost of 7 units = 1050 – 350 = ₹ 700

Average variable cost of 7 units = \(\frac{700}{7}\) = ₹ 100

Question 21. A firm’s average fixed cost is ₹ 20 at 6 units of output. What will it be at 3 units of output?

  1. ₹ 60
  2. ₹ 30
  3. ₹ 40
  4. ₹ 20

Answer: 3. ₹ 40

Average fixed cost = TFC/ Number of units

20 = TFC/6

T.F.C. = 20 × 6 = ₹ 120.

Average fixed cost of 3 units of output = TFC/ Total units

⇒ \(\frac{120}{2}\)

= ₹ 40.

Question  22.  Calculate the total cost of 4 units

Theory Of Production And Cost Calculate Total Cost Of 4 Units And Marginal Cost

  1. 140
  2. 120
  3. 50
  4. 40

Answer: 1. 140

Let the total cost of producing 4 units be ₹ x

Marginal Cost = Change in Total/Cost Change in Total Quantity

= \(\frac{x-80}{4-2}\)

= 30

= \(\frac{x-80}{2}\)

= x- 80 = 60

= x = 60 + 80

=₹ 140

Question 23.

Theory Of Production And Cost Find Average Fixed Cost Of 3 Units

Find the average fixed cost of 3 units 

  1. 10
  2. 0
  3. 65
  4. 60

Answer: 1. 10

= Average fixed cost /Quantity

= \(\frac{30}{3}\)

= 10

Question 24. Long run does not have

  1. Average Cost
  2. Total Cost
  3. Fixed Cost
  4. Variable Cost

Answer: 3. Fixed Cost

The long run is a period during which the firm can vary all its inputs, unlike the short run in which some inputs are fixed and others are variable. In other words, in the short run, the firm is tied with a given plant, in the long run, the firm moves from one plant to another, so the long run does not have any fixed cost.

Question 25.  Which of the following cun/e is not U-shaped?

  1. AFC
  2. A VC
  3. MC
  4. TC.

Answer: 1. AFC

Fixed cost remains fixed irrespective of several units produced and therefore average fixed cost keeps on decreasing as more and more units are produced. Due to this, the average fixed cost curve always slopes downward throughout its length and it is not of U shape.

Theory Of Production And Cost Average Fixed Cost Curve Is Never U Shaped

Question 26. From the following details, find out the average variable cost of 10 units

Theory Of Production And Cost Average Variable Cost Of 10 Units

  1. ₹ 40
  2. ₹ 20
  3. ₹ 200
  4. ₹ 400

Answer: 2. 20

Variable cost per unit = Difference in cost/ Difference in units produced

⇒ \(\frac{400-200}{10}\)₹

= ₹ 20 per unit

Variable cost of 10 units = ₹ 20× 10

= ₹ 200

Therefore, average variable cost = \(\frac{200}{10}\)₹

= ₹  20

Question 27. The total cost incurred for 10 units is T 400 and 20 units is ^ 800. Find the marginal cost.

  1. ₹ 400
  2. ₹ 40
  3. ₹ 200
  4. ₹ 20

Answer: 2. ₹ 40

Variable/Marginal cost may be expressed as:

Difference in cost/difference in units

In the given case

Marginal Cost = \(\frac{800-400}{20-10}\)₹

= \(\frac{400}{10}\)₹

= ₹ 40 per unit.

Question 28. Which one of the following is correct?

  1. AFC = AVC + ATC
  2. ATC = AFC-AVC
  3. AVC = AFC + ATC
  4. AFC = ATC – AVC.

Answer: 4. AFC = ATC – AVC.

The total cost of a business is the sum of the total variable cost and total fixed cost. Symbolically, TC = TFC + TVC. Similarly, average total cost is a  sum of average variable cost and average fixed cost i.e. ATC = AFC + AVC. This formula can also be expressed as:

AFC = ATC – AVC

Question 29. Calculate AFC of 3 units from the following data:

Theory Of Production And Cost Calculate AFC 3 Units

  1. ₹ 30
  2. ₹ 15
  3. ₹ 10
  4. ₹ 5

Answer: 3. ₹ 10

Fixed cost is the cost incurred even when no production is done, whereas the cost incurred on the production of units is called variable cost. Total cost is the summation of fixed cost and variable cost.

In the given case, at 0 units of output, the total cost is ₹ 30. This total cost comprises of only fixed costs and not variable costs as no units are produced.

Fixed cost always remains the same, irrespective of the number of units.

Therefore, the average fixed cost of 3 units will be:

AFC = TFC/ Number of units

AFC of 3 units = \(\frac{30}{3}\)₹

= ₹ 10

Question 30. Find AFC of 3 units 

Theory Of Production And Cost Find AFC Of 3 Units

  1. 5
  2. 10
  3. 15
  4. 25

Answer: 1. 5

Fixed cost remains the same, irrespective of the level of output.

In the given case, fixed cost = ₹ 15

Average fixed cost of.3 units =  Total fixed cost / Number of units

= ₹ \(\frac{15}{3}\)

AFC of 3 units = ₹ 5

Question 31. What will be the TVC if we produce 2 units?

Theory Of Production And Cost TVC We Produce 2 Units

  1. 15
  2. 05
  3. 17
  4. 30

Answer: 4. 30

At zero units of output TC = FC (since TC= FC+VC) So FC = 20,

At 2 units of output: TC = 50 and FC = 20 so variable cost = Total cost – Fixed cost

⇒ 50 – 20 = 30

Question 32. The total cost of production of 10 units is ^ 200. When production is increased to 20 units its total cost becomes ? 600. What will be its marginal cost?

  1. 400
  2. 40
  3. 4
  4. 30

Answer: 2.

Marginal Cost is expressed as:

Difference in total cost/ Difference in total units

= \(\frac{600-200}{20-10}\)₹

= \(\frac{400}{10}\)₹

= ₹ 40 per unit.

Question 33.

Theory Of Production And Cost AFC 4 Units Of Output

What will be the AFC at 4 units of output?

  1. 2
  2. 3
  3. 4
  4. 5

Answer:  4. 5

Average fixed cost is expressed as:

= Total fixed cost / Quantity = \(\frac{20₹ }{4 units}\)

= ₹  5 units per unit

Question 34. Payments made to outsiders for their goods and services are called

  1. Opportunity cost
  2. Real cost
  3. Explicit cost
  4. Implicit cost

Answer: 3. Explicit cost

Explicit cost (or Accounting cost) takes care of all the payments and charges made by the entrepreneur to the suppliers of various productive factors example, wages to workers employed, prices for the raw materials, fuel and power used, rent for the hired building, interest on money borrowed for doing business etc. These costs are included in the cost of production.

Question 35. Direct Cost is also known as 

  1. Indirect Cost
  2. Traceable Cost
  3. Opportunity Cost
  4. AccountingCost.

Answer: 2. Traceable Cost

Indirect cost is also known as non-traceable cost. Traceable cost is also known as direct cost. Accounting cost is also known as explicit cost.

Question 36. A firm’s AFC is ₹ 200 at 10 units of output what will be it at 20 units of output?

  1. 500
  2. 100
  3. 150
  4. 200

Answer: 2. 100

AFC = TFC/ Output

Now, TFC for 10 units of output = 200 × 10 = 2000

AFC for 20 units = \(\frac{2000}{20}\)

= 100

Question 37. Long run price is also called by the name of ________________

  1. Market price
  2. Normal price
  3. Administered price
  4. Wholesale price.

Answer: 2. Normal price

Long Run price is also known as Normal price

Question 38. What will be the AFC of 2 units according to the table given below

Theory Of Production And Cost AFC 2 Units According

  1. 105
  2. 135
  3. 235
  4. 290

Answer:  4. 290

TC at 0 Units of output = ₹ 580

TFC = ₹ 580.

AFC = TFC/Output

= \(\frac{580}{2}\)

= 290

Question 39. Fixed cost is known as _______________

  1. Prime
  2. Supplementary
  3. Overhead
  4. Direct

Answer: 3. Overhead

Fixed cost is also known as overhead cost since it continues to exist even if the operations are suspended. For example rent of factory.

Question 40. Average Revenue Curve is also known as.

  1. Profit curve
  2. Demand curve
  3. Supply curve
  4. Average cost curve

Answer: 2. Demand curve

The average Revenue Curve is also known as the Demand Curve.

Question 41. The supply curve remains unchanged, an increase in demand will lead to.

  1. A fall in price
  2. A rise in price
  3. No change in price.
  4. An increase in supply.

Answer: 2. A rise in price

Theory Of Production And Cost Supply Curve Remaining Unchanged An Increase In Demand Will Lead

An increase in demand without a change in supply to leads in price and quantity

Question 42. Find out AFC of 3 units:

Theory Of Production And Cost AFC Of 3 Units Of Output

  1. 100
  2. 200
  3. 300
  4. 400

Answer:  1. 100

Average fixed cost (AFC) = total fixed cost/ Number of units

In The given case,

Total fixed cost = ₹ 300

AFC for 3 units = \(\frac{300}{3}\)₹

= ₹ 100

Hence, AFC for 3 units is ₹ 100

Question 43.

Theory Of Production And Cost Calculate AFC At 2 Unit Of Output

Calculate AFC at 2nd unit of output

  1. ₹ 235
  2. ₹ 290
  3. ₹ 310
  4. ₹ 920

Answer: 2. ₹ 290

Average fixed cost (AFC) = total fixed cost/ Number of units

In The given case,

Total fixed cost = ₹  580

AFC for 3 units = \(\frac{580}{2}\)₹

= ₹ 290

Question 44. In the long run, all factors are 

  1. Fixed
  2. Variable
  3. All factors remain unchanged
  4. None.

Answer: 2. Variable

The long run is the period during which the firm can vary all of its inputs. In other words, in the long run, all factors are variable and no factor is fixed.

Question 45. What will be the AFC of 3 units of Output as per the table given below?

Theory Of Production And Cost AFC Of 3 Units Of Output

  1. 100
  2. 1,000
  3. 200
  4. 400

Answer: 1. 100

Total Fixed Cost =₹  300

Total output = 3 units

∴ AFC = TFC/ Q

= \(\frac{300}{3}\)

= ₹ 100

Question 46. What will be the marginal cost of 67 units of production according to the table given below

Theory Of Production And Cost Marginal Cost Of 67 Units Of Production

  1. 10
  2. 20
  3. 30
  4. 50

Answer: 3. 30

Change in total cost = 1400 – 500 = ₹ 900

Change in units of production = 67 – 37 = 30 units

MC per unit = Change in Total Cost/Change in units

= \(\frac{900}{30}\) ₹

= ₹ 30

Question 47. Which of the following is known as the Envelope Curve?

  1. Average variable cost curve
  2. Average total cost curve
  3. Long run average cost curve.
  4. Short-run average cost curve

Answer: 3. Long run average cost curve.

If a firm has a choice that a plant can be varied by infinitely small gradations so that there are an infinite number of plants corresponding. to which there are numerous average cost curves. In this case, the long-run average cost Curve will be a smooth curve enveloping all these short-run average cost curves. Thus, the long-run average cost curve is also known as the envelope curve.

Question 48. The average fixed cost for producing an output of 6 units of.a product a firm is ₹ 30. The same cost for producing an output of 4 units will be ₹  ____________________

  1. 50
  2. 45
  3. 25
  4. 20

Answer: 2. 45

Total Fixed Cost  (TFC)= 30 × 6 = ₹ 180

AFC for 4 units of output = TFC/Quantity

\(\frac{180}{Q}\) =  ₹ 45

Question 49 . 

Theory Of Production And Cost AFC 4 Units Output

What will be the AFC of 4 units of Output

  1. 2
  2. 3
  3. 4
  4. 5

Answer:  4. 5

Total Fixed Cost (TFC) = ₹ 20

Total units of output (Q) = 4 units

AFC = TFC/Q

= \(\frac{20}{4}\)

= ₹ 5

Question 50.  Suppose the total cost of production of commodity ‘X’ is? 1,25,000 Out of other cost implicit is? 35,000 and the normal profit is T 25,000 what will be the explicit cost of commodity ‘X’?

  1. ₹ 60,000
  2. ₹  65,000
  3. ₹ 90,000
  4. ₹ 80,000

Answer: 2. ₹ 65,000

Explicit Cost = Total Cost – Implicit Cost – Normal Profit

= 1, 25 000 – 35, 000- 25,000

=₹  65, 000

Question 51. What will be the total fixed cost for the production of three units as per the details given below

Theory Of Production And Cost Total Fixed Cost For The Production Of Three Units

  1. 620
  2. 640
  3. 1115
  4. 2650

Answer:  1. 620

Fixed cost is the cost which remains fixed even if the total output is zero. Also,

Total Cost = Fixed Cost + Variable Cost

At zero units of output, the variable cost will be zero.

620 = Fixed Cost + 0

So total fixed cost = ₹ 620.

Fixed cost remains constant irrespective of units of output.

Hence at 3 units of output also total fixed cost will be ₹620.

Question 52. Cost in terms of pain, discomfort, and disability involved in supplying the various factors of production by their owners are termed as 

  1. Social cost
  2. Explicit cost
  3. Real cost
  4. Implicit cost

Answer: 3. Real cost

Real cost refers to all those payments which are made to the factors of production to compensate for the efforts, pains, exertions or sacrifices suffered by them.

Real cost = efforts, pains, exertions and sacrifices of labour and capital + wait and abstinence of entrepreneur.

Real cost is the cost in terms of pain and sacrifice made to produce goods and services. It includes the cost of producing goods and services as well as the cost of all resources used and the cost of not employing those resources in alternative uses.

Question 53. Which of the following is known as the Envelope Curve?

  1. Average variable cost curve
  2. Average total cost curve
  3. The long-run average cost curve
  4. Short run average cost curve.

Answer: 3. Long run average cost curve

Long Run Average Cost Curve (LAC) is a U-shaped curve. When the LAC curve is declining it is tangent to the failing portions of the short-run cost curves and when the LAC is rising it is tangent to the rising portions of the short-run cost curves. In simple words, the long-run average cost curve envelops all the short run cost curves and – hence is known as the envelope curve.

Theory Of Production And Cost Long Run Average Cost Curve Is A U Shaped

Question 54. The cost of resources owned and employed by the entrepreneur himself in his business is termed as _________________  cost.

  1. Explicit
  2. Implicit
  3. Fixed
  4. Variable.

Answer: 2. Implicit

Implicit costs are the costs for which payment in money terms is not made. These are the cost of factors owned by the entrepreneur himself and employed in his own business. For example, An entrepreneur uses his land for production. If he had rented that land he would have earned rent.

So the cost of using his land in the business is known as the implicit cost.

Question 55. A firm will close down in the short period if its average revenue is less than its:

  1. Average cost
  2. Average variable cost
  3. Marginal cost
  4. Average fixed cost ’

Answer: 2. Average variable cost

A firm should close down in the short run if it is not able to recover its variable cost. A firm shall continue to run if it is not able to meet its fixed cost because it may recover it in future. But variable cost. is incurred to meet the payment of raw material, labour etc. which should be met otherwise the firm should close down.
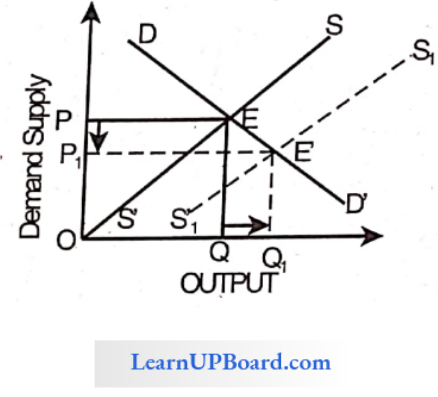
Question 56. A firm’s total cost is ? 200 at 5 units of output and X 220 at 6 units of output. The marginal cost of producing 6th unit of output will be ________________

  1. 20
  2. 120
  3. 220
  4. 320.

Answer: 1. 20

Marginal Costn = TCn-TCn-1

= TC6-TC6-1

= TC6-TC5

= 220 – 200

= ₹ 20 per unit

Question 57. Consider the following data Units of

Theory Of Production And Cost Consider The Units Of Output

The Average Variable Cost (AVC) for an output of 4 units will be 

  1. ₹ 20
  2. ₹ 30
  3. ₹ 25
  4. ₹  26

Answer: 1.₹  20

VCP.U. Difference in Total Cost/ Difference in units produced

= \(\frac{105 -25}{4-0}\)

= \(\frac{80}{4}\)

= ₹ 20 p.u

VC of 4 units =  20 × 4

= ₹  80

AVC = \(\frac{80}{4}\)

= ₹  20

Question 58. The change in total cost due to one unit change in the output is called  _______________ cost.

  1. Marginal
  2. Average
  3. Average variable
  4. Average fixed

Answer: 1. Marginal

Marginal cost is the addition made to the total cost by production of an additional unit of output.

Question 59. When the AC curve is rising, the MC curve must be ______________  to it.

  1. Equal
  2. Above
  3. Below
  4. Parallel.

Answer: 2. Above

When the AC curve rises as a result of an increase in output, MC is more than AC i.e. MC curve is above the AC curve.

Question 60. The Average fixed cost for producing an output of 6 units of a product by a firm is ₹ 30. The same cost for producing an output of 4 units will be ₹ _______________ 

  1. 50
  2. 45
  3. 25
  4. 20

Answer: 2. 45

AfC = TfC/ Number of units

30 = TFC/6

∴  TFC = 30 × 6 =  ₹ 180

So, AVC for 4 units of output = \(\frac{180}{4}\)

= ₹  45

Question 61. Which of the following cost curves will slope downward and does not touch the x-axis?

  1. Average cost curve
  2. Marginal cost curve
  3. Average variable cost curve
  4. Average fixed cost curve.

Answer: 4. Average fixed cost curve.

The total fixed cost is a constant amount, i.e. it is fixed in nature. The average fixed cost will steadily fall as output increases. Therefore, if we draw the average fixed cost curve it will slope downwards throughout its length but will not touch to x-axis as AFC cannot be zero.
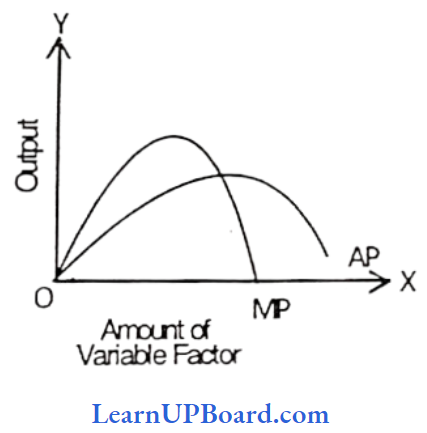
Question 62.  Suppose the total cost production of a commodity ‘x’ is ₹ 1,25,000 out of which Implicit cost is ₹ 35,000 and normal profit is ₹ 25,000. What would be the explicit cost of commodity x?

  1. 90,000
  2. 65,000
  3. 1,00,000
  4. 60,000

Answer: 2. 65,000

Total cost = ₹ 1,25,000

Implicit cost = ₹ 35,000

Normal profit = ₹  2,50,000

Explicit cost =?

Total cost = Explicit cost + Implicit cost + Normal profit

1,25,000 = Explicit cost + 35,000 + 25,000 = 1,25,000 -435,000 – 25,000

= 65, 000

Question 63.  In which of the following cases opportunity cost concept apply?

  1. Resources have alternative uses
  2. Resources have limited uses
  3. Resources have no use
  4. None of the above.
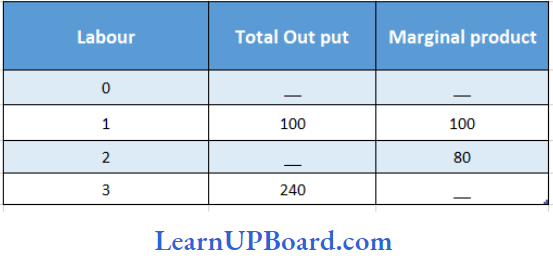
Answer: 1. Resources have alternative uses
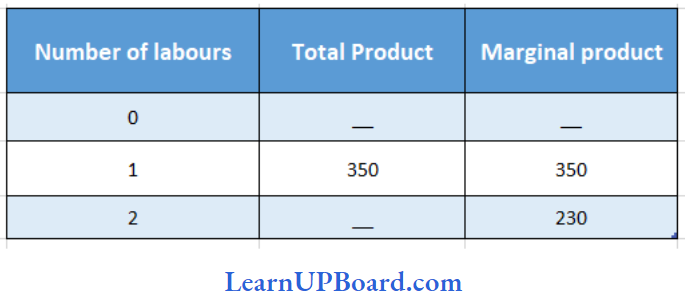
Opportunity cost refers to the cost of opportunity forgone involving a comparison between the alternative chosen and the alternative forgone. It  relates to the sacrificed alternatives
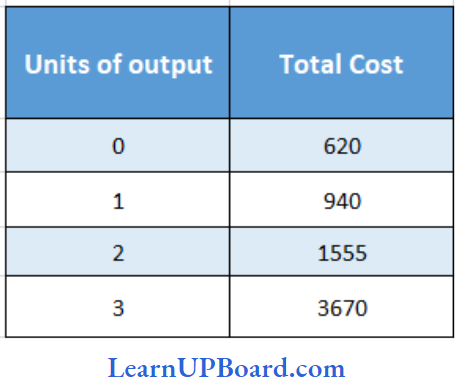
Thus, the opportunity cost concept applies where the resources have alternative uses.
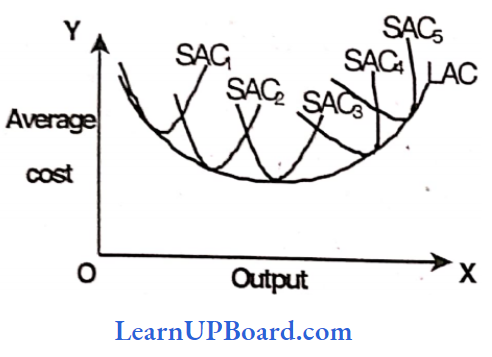
Question 64. Direct costs are also known as _____________________

  1. Traceable costs
  2. Indirect costs
  3. Opportunity costs
  4. Real costs.

Answer: 1. Traceable costs

Direct costs are costs that are readily identified and are traceable to a particular product operation or plant. It is also known as Traceable Cost.

Question 65.  Which statement below is correct in reference in Average Fixed Cost

  1. Never becomes zero
  2. The curve never touches the X-axis
  3. The curve never touches the y-axis
  4. All of the above

Answer: 4. All of the above

Average fixed cost never touches any axis but it slopes downward, Average fixed cost can never be zero even if there is no production so it can never touch any axis. AFC falls when output increases as ffxed cost is always fixed.

Question 66. Marginal cost changes due to changes in  ________________ cost.

  1. Total
  2. Fixed
  3. Average
  4. Variable

Answer: 4. Variable

Marginal copy is the addition made to the total cost by the production of an additional unit of output. It is independent of fixed cost, It is only the variable costs which change with a change in the level of output in the short run.

Question 67. A firm produces 10 units of a commodity at an average total cost of ? 200 and with a fixed cost of? 500. Find out the component of average  variable cost in the total cost

  1.  ₹  300
  2.  ₹  200
  3. ₹ 150
  4.  ₹  100

Answer: 3. ₹  150

The average total cost of 1 unit = ₹ 200

Total cost of 10 units = 200 × 10 = ₹  2,000

Total fixed cost = ₹ 500

Total variable cost = total cost – total fixed cost = 2,000 – 500 = ₹ 1,500

Variable cost of 1 unit = 1500/10 = ₹  150

Hence, a component of average variable cost in the total cost is = ₹ 150.

Question 68. The average total cost to a firm is ₹ 600 when it produces 10 units of output and ₹ 640 when the output is 11 units. The MC of the 11th unit is 

  1.  ₹  40
  2.  ₹  540
  3.  ₹  840
  4.  ₹  1,040

Answer: 4. 1,040

The average total cost of 10 units of output  ₹  600 Average total cost of 11 units of output = is ₹ 640

The marginal cost of 111h unit=Total cost of 11 units -Total cost of 10 units

= (640 × 11)  – (600 × 10) ₹

= ₹  1,040

Question 69. The average cost of producing 50 units of any commodity is  ₹  250 and the fixed cost is ₹ 1,000. What will be the average fixed cost of producing 100 units of the commodity?

  1.  ₹  10
  2.  ₹  30
  3.  ₹  20
  4.  ₹   05

Answer: 1. ₹  10

The fixed cost of producing 50 units is 1,000 and the fixed cost of producing 100 units will also be the same i.e.  ₹  1,000.

The Average Fixed Cost of 100 units Fixed Cost  1,000

AFC= Fixed cost/ Quantity

=  \(\frac{1000}{100}\) ₹

= ₹  10

Question 70. A company produces 10 units of output and incurs ₹ 30 per unit as variable cost and ₹  5 per unit of fixed cost. What will be the total cost of producing 10 units?

  1.  ₹  300
  2.  ₹  35
  3.  ₹  305
  4.  ₹  350

Answer: 4. ₹ 350

The total cost of producing 10 units is:

Total Cost → Total Fixed Cost + Total Var. Cost

⇒ 10 × 5 + 10 × 30

⇒ 50 + 300

= ₹ 350

Question 71. Based on the following data, what will be the marginal cost of the 6th unit of output?

Theory Of Production And Cost Basis Of The Following Data The Marginal Cost of The 6 th Unit Of Output

  1.  ₹ 133
  2.  ₹ 75
  3.  ₹ 80
  4.  ₹ 450

Answer:  3. ₹ 80

Theory Of Production And Cost Basis Of The Following Data The Marginal Cost of The 6 th Unit Of Output.

Question 72. The positively sloped (rising) part of the long-run average cost curve indicates the working of the_________________.

  1. Diseconomies of scale
  2. Increasing returns to scale
  3. Constant returns to scale
  4. Economies of scale

Answer:  1. Diseconomies of scale

The positively sloped (rising) part of the long-run average cost curve indicates the working of the diseconomies of scale. Because rising LFAC and diminishing returns to scale result from internal and external diseconomies of scale.

Question 73.  The average fixed cost curve is always

  • Declining when output increases
  • U-shaped, if there are increasing returns to scale
  • U-shaped, if there are decreasing returns to scale
  • Intersected by marginal cost at its minimum point

Answer: 1. Declining when output increases

Average fixed cost will steadily decline as output increases. If we draw an AFC it will slope downwards throughout its length but will not touch the x-axis as AFC can’t be zero.

Question 74.  The planning curve is related to which of the following?

  1. Short-run average cost curve
  2. The long-run average cost curve
  3. Average variable cost
  4. Average total cost.

Answer: 2. Long run average cost curve

Answer: 4. Average total cost.

A long-range average cost curve is often called a planning curve because a firm plans to produce any output in long run by choosing a particular plant in the long run and the average cost curve corresponding to the given output.

Question 75. Using the following data find out the marginal cost (MC) of the sixth unit Solve the question

Theory Of Production And Cost Marginal Cost Of The 6 Unit Of Outut

  1. 24
  2. 16
  3. 20
  4. 21

Answer: 3. 20

M C = ΔTC/ ΔQ

=   MCn = TCn – TCn-1

=  MC6 = TC6 – TC5

MC = 168 – 148

= 20

Question 76. What will be the marginal cost, when output is 5 units?

Theory Of Production And Cost Output Units TFC And TVC And MC

  1. 300
  2. 400
  3. 500
  4. 600

Answer: 1. 300

M.C = Δ T.C / ΔQ =  Change in Total Cost/ Change in Quantity

T.F.C = 500

T.V.C for 5 units =1,600

T.C. for 5 units

= T.F.C + T.V.C

= 500 + 1,600

= 2,100

T.F.C = 500

T.V.C for 1 unit = 400

T.C. for 1 unit

= 500 + 400 = 900

= \(\frac{1200}{4}\)  = 300

Question 77. Diminishing marginal returns implies

  1. Decreasing average variable costs
  2. Decreasing marginal costs
  3. Increasing marginal costs
  4. Decreasing fixed costs.

Answer: 3. Increasing marginal costs

It states that as one input variable is increased there is a point at which the marginal increase in output increases and then begins to decrease, leading to an increase in the marginal cost with every additional unit.

Question 78. When the output of a firm increases in the short run, its average fixed cost

  1. Increases
  2. Decreases
  3. Remains constant
  4. First declines and then rises.

Answer: 2. Decreases

Since TFC is a constant amount, AFC will steadily fall as output increases.

Question 79.  Which of the following cost curves is never ‘U’ shaped?

  1. Average cost curve
  2. Marginal cost curve
  3. Average variable cost curve
  4. Average fixed cost curve.

Answer: 4. Average fixed cost curve.

The average fixed cost curve is never “U” shaped because it slopes Downward through its length and never touches X1 axis.

Question 80. Fixed cost curve normally

  1. Starts from the origin
  2. Is U shaped
  3. Is vertical line
  4. Is a horizontal line.

Answer: 4. Is a horizontal line.

Fixed costs are those costs which are independent of output i.e. they do not change with changes in output. Thus, the fixed cost curve normally is a horizontal line.

Question 81. A rational producer will produce in the stage in which the marginal product is positive and

  1. MP > AP
  2. MP = AP
  3. MP < AP
  4. MP is zero.

Answer: 3. MP < AP

A rational producer will produce in the stage in which the marginal product is positive and MP<AP. As in this case, a producer could increase the average product of labour by decreasing the quantity of labour slightly.

Question 82. The vertical difference between TVC and TC curves is equal to

  1. MC
  2. A VC
  3. TFC
  4. None of the above.

Answer: 3. TFC

The total cost of a business is the sum of total variable cost and total fixed cost or symbolically TC = TFC + TVC. upward showing thereby that as output increases, total variable cost increases. This curve starts from the origin which shows when output is zero,  variable costs are also nil. The total cost curve thus has been obtained by adding vertically the total fixed cost curve and the total variable cost curve.

Theory Of Production And Cost Total Fixed Cost And Total Variable Cost

Question 83. What happens to marginal cost when average cost increases?

  1. Marginal cost is below average cost
  2. Marginal cost is above average cost
  3. Marginal cost is equal to average variable cost
  4. Marginal cost is equal to average cost.

Answer: 2. Marginal cost is above average cost

The relationship between marginal cost and the average cost is the same as that between any other marginal average quantity when the average cost rises as a result of an increase in output marginal cost is more than the average cost.

Question 84. If the market price of good is more than the opportunity cost of producing it, then

  1. The market price of the product will increase in the long run
  2. Producers will increase supply in the long run
  3. Marginal cost is above average cost
  4. The situation will remain unchanged as long as supply and demand remain in balance. ‘

Answer: 2. Marginal cost is above average cost

If the market price of a good is more than the opportunity cost of producing it then the producer will increase supply in the long run that is the amount of a good or service that producers are willing and able to offer to the market at various prices during the time.

Question 85.  A firm has variable costs of ₹ 1,000 at 5 units of output. If fixed costs are X 400. what will be the average total cost at 5 units of output?

  1. 360
  2. 600
  3. 260
  4. 400

Answer:  3. 260

Variable Cost = ₹ 1,000 at 5 unit Fixed Cost = ₹ 400

Total cost = Variable cost + Fixed cost v =1000 + 400

= 1400 at 5 units.

Average total cost = \(\frac{1400}{5}\)

= ₹ 280

Question 86.  The average total cost of producing 50 units is ₹ 250 and the total fixed cost is ₹ 1,000. What is the average fixed cost of producing 100 units?

  1. 5
  2. 30
  3. 20
  4. 10

Answer: 4. 10

ATC of 50 units = ₹ 250

TFC =  ₹1,000

AFC of 100 units = \(\frac{1000}{100}\)

= ₹ 10

Question 87. When the average fixed cost is ₹ 20 at 6 units of output, what will it be at 4 units of output?

  1. ₹ 60
  2. ₹ 30
  3. ₹ 40
  4.  20

Answer: 2. ₹ 30

AFC = 20 at 6 units of output

TFC = 20 × 6

= 120

AFC at 4 units of output

= \(\frac{120}{4}\)

= ₹  30

Question 88. Modern industrial units face ____________________ technology of production.

  1. U shaped
  2. L shaped
  3. Dish shaped
  4. J shaped

Answer: 2. L shaped

L-shaped cost curve.

U U-shaped cost curve could exist only when the state of technology remains constant but, the empirical evidence shows that the state of technology changes in the long run.

Therefore, modern industrial units face an ‘L’ shaped cost curve rather than ‘U’ shaped cost curve.

Question 89. What will be AVC in the production of 3 units according to the following cost data?

Theory Of Production And Cost Production Of Units Will Be AVC

  1. 80
  2. 100
  3. 110
  4. 240

Answer: 2. 100

AVC = TVC/Q

= TC- TFC/ Q

= \(\frac{380-140}{3}\)

= \(\frac{240}{3}\)

= 80.

Question 90. The costs which remain fixed over a certain range of output but suddenly jump to a new higher level when production goes beyond a given limit  are called:

  1. Variable cost
  2. Semi-variable cost
  3. Stair-step variable cost
  4. Jumping cost.

Answer: 3. Stair- step variable cost

Stair-Step Variable Costs are the costs which increase in a stair-step fashion i.e. they remain fixed over a certain range of output, but suddenly jump to a new higher level when output goes beyond a given limit. example. The fixed salary of the foreman will have a sudden jump if another foreman is appointed when the output crosses a particular limit.

Question 91. A firm producing 9 units of output has an average total cost of ? 200 and has to pay ₹ 630 to its fixed cost of production. How much of the average total cost is made up of variable costs?

  1. ₹ 150
  2. ₹ 130
  3. ₹ 70
  4. ₹ 300

Answer: 2.₹  130

Variable Cost = Total Cost – Fixed Cost = (200 × 9) – 630

= 1,170

AVC = TVC/Q

⇒ \(\frac{1170}{9}\)

= ₹ 130

Question 92. The cost of one thing in terms of alternative given up is known as

  1. Opportunity Cost
  2. Real Cost
  3. Production Cost
  4. Physical Cost.

Answer: 1. Opportunity Cost

Opportunity cost is concerned with the cost of forgone opportunity; it involves a comparison between the policy that was chosen and the policy that was rejected.

For example, the opportunity cost of using capital is the interest that it can earn in the next best use with equal risk.

Question 93. In the short run, when the output of a firm increases, its average fixed cost

  1. Remains constant
  2. Decreases
  3. Increases
  4. First decreases and then rises

Answer: 2. Decreases

Yes in the short run, when the output of a firm increases its average fixed cost decreases. When the output is 100 units the AFC will be ₹  20. And now if the output increases to 200 units, AFC will be ₹ 10. Hence, cost decreases.

Question 94. What will be the average variable cost of producing 5 units of blankets as per the details given in the following table?

Theory Of Production And Cost Blankets

  1. ₹ 500
  2. ₹ 750
  3.  900
  4.  1,000

Answer: 3. ₹ 900

Average variable Difference in Total Cost/Difference in units

⇒ \(\frac{6000-1500}{5-0}\)

= \(\frac{4500}{5}\)

= ₹ 900 per unit

Question 95. Which of the following is/are example(s) of an economic cost?

  1. Wage paid to labourers
  2. Raw materials purchase, cost
  3. Interest paid on short-term loan
  4. All of the above

Answer: 4. All of the above

Economic cost = explicit cost + implicit cost.

Explicit cost refers to those costs only which involve cash payments of the entrepreneur of the firm.

Implicit cost refers to the amount of money the entrepreneur could have earned if he had invested his money and sold his services and other factors in the next best alternatives.

Question 96. Opportunity Cost is:

  1. Marginal cost
  2. Variable cost
  3. Total fixed cost
  4. None of these.

Answer: 4. None of these.

Opportunity Cost of a given activity is defined as the value of the next best activity and it is not related to any cost. It means sacrificing of one good for another good to give satisfaction to self.

Question 97. The “law of diminishing returns ” applies to

  1. The short run, but not the long run
  2. The long run, but not the short run
  3. Both the short run and the long run
  4. Neither the short run nor the long run
  5. Answer: 1. The short run, but not the long run

The law of diminishing return’ applies to the short run but not in the long run as in the short run a fixed cost does not change while a variable cost changes but in the long run both change. Supply Production cannot increase in the short run whether there is a loss or profit.

Question 98. Linear homogenous production function is based on

  1. Increasing returns to scale
  2. Decreasing returns to scale
  3. Constant returns to scale
  4. None of the above.

Answer: 3. Constant returns to scale

Linear Homogenous production is based on constant return to scale because output increases in the same way as an increase in input or we can say that an increase in output is equal to an increase in input. Sole proprietorship production is based on a constant return to scale for a lifetime.

Question 99. Which of the following cun/e is not U-shaped?

  1. AFC
  2. MC
  3. AVC
  4. TC

Answer: 1. AFC

AFC is the cost obtained by dividing the total fixed cost by the number of units of output.

AFC = TFC/Q

= (Total Fixed Cost)/ (No. of units of output)

TFC can never be U-shaped as it will fall as total output increases and will not touch the X-axis. It can also never be zero.

Question 100. Which of the following curves never touches any axis but is downward

  1. Marginal cost curve
  2. Total cost curve
  3. Average fixed cost curve
  4. Average variable cost curve

Answer:  3. Average fixed cost curve

Average fixed cost is a curve that cannot touch any axis so, it can never be zero. When total production increases then average fixed cost steadily falls but never touches the axis.

Question 101. External economies accrue due to __________________

  1. Increasing returns to scale
  2. Increasing returns to factor
  3. Law of variable proportions
  4. LOW cost

Answer: 1. Increasing returns to scale

Increasing return to scale means when there is an increase in output is more than an increase in input or in other words increases in, output an increase in input and there are some factors or external economies which tend to increase return to scale.

Question 102. A firm’s average fixed cost is ? 20 at 6 units of output what will be at 3 units of output?

  1. ₹ 60
  2. ₹ 30
  3. ₹ 40
  4. ₹ 20

Answer: 3. ₹ 40

The average fixed cost is 20 at 6 units and what will be at 3 units

AFC at 6 units = 20

AFC at 3 units = \(\frac{20}{3}\)  × 6

= ₹ 40

As we AFC is decreasing steadily by increasing total production. So, AFC at 3 units is 40, and at 6 is 20.

Question 103. Which of the following is correct?

  1. AFC = AVC + ATC
  2. ATC = AFC-AVC
  3. AVC = AFC + ATC
  4. AFC = ATC-AVC

Answer: 4. AFC = ATC-AVC

Average fixed can be obtained in two ways:

AFC =  TFC/ Q=  Total Fixed Cost / Number of units of output

AFC = ATC-AVC

Where, ATC = Average total cost and AVC = Average variable cost. .

Question 104. The vertical difference between TVC and TC curves is equal to

  1. MC
  2. AVC
  3. TFC
  4. None of the above.

Answer: 3. TFC

Total Variable Cost (TVC) and Total Cost (TC) is differences of TFC (Total Fixed Cost) Formula Derived is:

TC = TVC + TFC

TC – TVC = TFC

This is the vertical difference between Total Variable Cost and Total Cost.

Question 105. The cost of one thing in terms of alternative given up

  1. Real cost
  2. Production cost
  3. Opportunity cost
  4. Physical cost (1 mark)

Answer: 3. Opportunity cost

Opportunity cost is the cost that means the next best activity or sacrificing of one good thing for another.

Question 106. The cost which remains fixed over a certain range of output but suddenly jumps to a new higher level when production goes beyond a given limit are called

  1. Variable cost
  2. Semi-variable cost
  3. Stair-step variable cost
  4. Jumping cost

Answer: 3. Stair-step variable cost

2 Stair-step Variable cost which means the cost which remains fixed for a long time but suddenly jumps to a new higher level when production goes beyond a given limit.

Question 107. The shape of the Average Fixed cost curve is?

  1. Falls from left to right
  2. Rises from left to right
  3. Parallel to x-axis
  4. Parallel to y-axis

Answer: 1. Falls from left to right

The shape of Average Fixed Cost is hyperbola in shape it falls from left to right but does not touch the x-axis.

Question 108. The price of a commodity is best expressed as

  1. Exchange value
  2. Cost of goods sold
  3. Production cost
  4. Nominal value

Answer: 1. Exchange value

The price of a commodity is expressed as its exchange value as it is the price at which jt will be sold or purchased.

Question 109. Accounting cost is Economic cost

  1. Equal to
  2. Less than
  3. More than
  4. Not Included

Answer: 2. Less than

Accounting cost is explicit cost and economic cost is Explicit + Cost + National cost therefore, accounting cost is less than economic cost.

Question 110. When AC Curve is at minimum then MC Curve is?

  1. Minimum then AC Curve
  2. Equals to AC Curve
  3. ‘ Above AC Curve
  4. Less than AC Cun/e

Answer: 2. Equals to AC Curve

When the average cost is minimum, MC is equal to the Ac. In other words, the MC curve cuts the AC curve at its minimum point.

Question 111. Which of the following equations represents the profit maximisation condition?

  1. MC = MR
  2. MC > MR
  3. – MC < MR
  4. None.

Answer: 1. MC = MR

Profit will be at the maximum level when marginal Revenue is equal to marginal cost therefore, it can cover its cost and survive in the economy.

Question 112. MC curve of a firm in a perfectly competitive industry depicts?

  1. Demand curve
  2. Supply curve
  3. Average cost curve
  4. Total cost curve

Answer: 2. Supply curve

MC curve is rising upward in a competitive market therefore, it depicts the supply curve.

Question 113. Issues requiring decision-making in the context of business are:

  1. How much should be the optimum output at what price should the firm sell?
  2. How will the product be placed in the market?
  3. How to combat the risks and uncertainties involved?
  4. All of the above.

Answer:  4. All of the above.

All the given options are required for making business decisions in the context of business therefore, the answer will be (4) all of the above.

Question 114. The law of production does not include?

  1. Returns to scale
  2. Law of variable proportion
  3. Law of diminishing returns to a factor
  4. Least cost combination factors

Answer: 4. Least cost combination factors

The least cost combination factor is not included in the law of production function.

Question 115. A firm producing 15 units of output has an average cost of ₹ 250 and ₹ 125 as per unit cost for fixed factors of production.

The average variable cost will be

  1. 180
  2. 150
  3. 125
  4. None of the above

Answer: 3. 125

Average total cost (ATC) = AFC + AVC

ATC = 250; AFC = 125

AVC =  ATC- AFC

= 250-125

= ₹ 125

Question 116. Which of the following statements is incorrect?

  1. AC is sloping downwards, MC is below AC
  2. AC is sloping downwards, MC must fall
  3. AC is sloping upwards, MC is above AC
  4. MC cuts AC at its lowest point.

Answer: 2. AC is sloping downwards, MC must fall

The relationship between Average cost and Marginal cost is as follows:

  • When average cost falls as a result of an increase in output, marginal cost is less than average cost.
  • When the average cost rises as a result of an increase in output, the marginal cost is more than the average cost.
  • When the average cost is minimum, the marginal cost is equal to the average cost.

Theory Of Production And Cost Relationship Between Average Cost And Marginal Cost

Question 117. Diminishing marginal returns implies.

  1. Decreasing average fixed cost *
  2. Decreasing average variable cost
  3. Decreasing marginal cost
  4. Increasing marginal cost

Answer: 4. Increasing marginal cost

Diminishing marginal Returns implies an increase in marginal cost.

Marginal cost is the increase in the total cost of production if one additional unit of output is produced.

Question 118. Opportunity Cost is

  1. Recorded in the book of accounts
  2. Sacrificed alternative
  3. Both (1) and (2)
  4. None of the above

Answer: 4. None of the above

Opportunity cost is the cost of the next best alternative foregone. It is generally not recorded in the books of accounts. Thus, it can be said that opportunity cost is the sacrificed alternative whose cost is not recorded in books of accounts.

Question 119. Which of the following is true? 

  1. TC = TFC + TVC
  2. TC + TVC + TFC
  3. 2TC – TVC = TFC
  4. None

Answer: 1. TC = TFC + TVC

Total Cost = Total Fixed Cost + Total Variable Cost i.e. TC =  TFC + TVC

Theory Of Production And Cost Total Fixed Cost And Total Variable Cost

Question 120. Total Economic Cost = Explicit Cost + Implicit Cost

  1. Normal Profit
  2. Super Normal Profit
  3. Loss
  4. None

Answer: 1. Normal Profit

Total Economic Cost = Explicit Cost + Implicit Cost + Normal Profit

As economic cost includes :

  1. Normal return a money capital invested by the entrepreneur himself in his cum business.
  2. The wages or salary not paid to the entrepreneur, but could have been earned if the services had been sold somewhere else.
  3. It also takes into account, accounting costs. And also the normal profit earned.

Question 121. The economic cost of production differs from the accounting cost of production

  1. Partially True
  2. True
  3. False
  4. None

Answer: 2. True

  • The economic cost of production differs from the accounting cost. production is TRUE as
  • Economic cost includes both explicit cost and implicit cost.
  • Whereas Accounting cost only includes the amount spent i.e. Explicit Cost

Question 122. Which curve is never U- U-shaped

  1. AFC
  2. AVC
  3. AC
  4. None

Answer: 1. AFC

The average fixed cost curve is never U-shaped. The average Fixed Cost diminishes as the production increases (though the fixed cost remains constant) .

Theory Of Production And Cost Fixed Cost Remains fixed irrespective Of Number Units

AFC = TF/ Q

It will slope downwards throughout its length but will not touch the X-axis as AFC cannot be zero.

And AVC and AC curves are U-shaped i.e.

Theory Of Production And Cost AVC And AC Curves Are U shaped

Question 123. Use the table and answer the following questions

Theory Of Production And Cost Average Fixed Cost Of 4 Units Of Out Put

The average fixed cost of 4 units of output is:

  1. 80
  2. 90
  3. 25
  4. 350

Answer: 3. 25

In the given table, we see that o level of output TC = 100 which is also equal to TFC.

TC = TFC= 100

Thus TFC of 4 units = 100

AFC = TFC/Q

= \(\frac{100}{4}\)

= 25

Question 124. The average variable cost of 5 units of output

  1. 84
  2. 64
  3. 420
  4. 104

Answer:  2. 64

AVC at 5 units

AFC = TVC/Q

TVC = TC-TFC

= 420- 100

= 320

= \(\frac{320}{5}\)

= 64

Question 125. The marginal cost of 5th unit of output is

  1. 60
  2. 70
  3. 540
  4. 90

Answer: 1. 60

MC = at 5 units MC = TC5-TC5-1

= TC5 – TC4

= 420 – 360

= 60

Question 126. The total cost is ₹ 4,200 and the fixed cost is ₹ 1,200 then find the variable cost

  1. ₹ 5,450
  2. ₹ 1,200
  3. ₹ 4,200
  4. ₹ 3,000

Answer: 4. ₹ 3000

TC = 4200

TFC = 1200

Variable cost = ₹ 4200 – v 1200,

= ₹  3000

Question 127. A Firm producing 7 units of output has an average total cost of ₹ 150 and has to pay₹  350 to its fixed factors of production whether it produces or not? How much of the average total cost is made up of variable costs?

  1. 200
  2. 50
  3. 300
  4. 100

Answer: 4. 100

Units = 7, ATC= 150, PC = 350

150 × 7 = TC

TC = 1050

TC = FC + VC

1050 = 350 + 700

ATC = AFC + AVC

TC/Q = FC/Q+ VC/Q

= \(\frac{1050}{7}\) = \(\frac{350}{7}\)+ \(\frac{700}{7}\)

= 150 = 50 + 100

Thus Average variable cost is ₹ 100.

Question 128. A Firm has a variable cost of X 2,000 at 5 units of output. If fixed costs are? 800, what will be the average total cost at 5 units of output?

  1. 560
  2. 120
  3. 240
  4. 2,800

Answer: 1. 560

Units = 5

VC= 2000

Fc= 800

TC = FC + VC

= 2000 + 800

= 2800

ATC = TC/ Q

= \(\frac{2800}{5}\)

= 560

Question 129. Which of the following Statements is false?

  1. Economic costs include the opportunity costs of the resources owned by the firm.
  2. Accounting costs include only explicit costs.
  3. Economic profit will always be less than accounting profit if resources owned and used by the firm have any opportunity costs.
  4. Accounting profit is equal to total revenue less implicit costs.

Answer: 4. Accounting profit is equal to total revenue less implicit costs.

Accounting profit is equal to total revenue less implicit cost Accounting profit = TR – Implicit Cost

Question 130. The average cost curve is

  1. ‘U’ Shaped
  2. Positively sloped
  3. Negatively sloped
  4. Rectangular hyperbola

Answer: 1. ‘U’ shaped. –

The average cost curve is ‘U’ shaped due to the law of variable proportion.

Theory Of Production And Cost Average Cost Curve Is Of U shaped The Law Of VAriable Proportion

Question 131.  Isoquants are equal to

  1. Product lines
  2. Total utility lines
  3. Cost lines
  4. Revenue lines

Answer: 1. Product lines

An Isoquant consists of alternative combinations of input to produce a given quantity of output and product lines are lines representing various combinations of factors of production to produce a given output.

Question 132. Average fixed cost can be obtained through.

  1. AFC = TFC/TS
  2. AFC= EC/TU
  3. AFC= TC/PC
  4. AFC = TFC/TU

Answer:  4. AFC = TFC/TU

Use the table below to answer Questions 133 to 135.

Theory Of Production And Cost Average Fixed Cost Of 3 Units Of Out Put

Question 133.  The average fixed cost of 3 units of output is ______________

  1. 180
  2. 225
  3. 120
  4. 134

Answer: 3. ₹ 120

AFc = IFC/Q

AFC = \(\frac{360}{3}\)

= ₹120

AFC = ₹ 120

Question 134. The marginal cost of the fifth unit of output is _______________

  1. ₹  174
  2. ₹ 225
  3. ₹ 675
  4. ₹ 105

Answer:  4. ₹ 105

Theory Of Production And Cost Marginal Cost Of The Fifth Unit Of Out Put

Marginal Cost of the Fifth unit  = 105

Question 135. Diminishing marginal returns starts to occur between __________________units

  1. 4 and 5
  2. 3 and 2
  3. 5 and 6
  4. 1 and 2

Answer:  1. 4 and 5

According to the above table, Diminishing marginal return starts to occur between 4 and 5 units.

Question 136. The difference between TFC and TC is equal to

  1. Zero
  2. TVC
  3. MC
  4. AFC

Answer:  2. TVC

The difference between TFC and TC is equal to TVC

TC = TFC +TVC

TVC = TC – TFC

Question 137. The Marginal Revenue curve moves________________ and the Marginal cost curve moves ______________

  1. Downward,  Downward,
  2. Downward, Upward upward,
  3. Upward,  Downward,
  4. Downward, Remains same.

Answer:  2. Downward, Upward upward,

The marginal revenue curve is downward sloping and below the demand curve and the additional gain from increasing the quantity sold is lower than the chosen market price. Both these curves are intersected at their minimum points by Marginal Cost (MC), which slopes upward.

If the price of the variable input increases all three cost curves move upwards as shown alongside. They retain their shape and characteristics as described above.

Question 138. The average revenue curve is also known as

  1. Firm’s Demand Curve
  2. Marginal Revenue Curve
  3. Total Revenue Curve
  4. Marginal Cost Curve

Answer:  1. Firm’s Demand Curve

The average revenue curve is also known as a demand card in the business market. Average revenue is the division of total revenue (TR) by quantity (Q) which also means Average revenue is equal to the price of each product.

Question 139. If quantity demanded for a commodity increases from 15 units to 20 units there is a 25 percent decrease in price. If the initial price was ₹ 20, then what is the marginal revenue?

  1. 15
  2. 20
  3. 0
  4. 10

Answer:  3. 0

If quantity demanded for a commodity increases from 15 units to 20 units there is a 25% decrease in price. The initial price is ₹ 20;

⇒ 20-25 % of 20

= 20-5

= ₹15

Then marginal revenue will be zero.

Question 140. The marginal, average and total product curves encountered by the firm producing in the short-run exhibit all of the following relationships except ______________

  1. When TP is rising, Average and Marginal products may be either rising or falling.
  2. When the marginal product is negative, the total product and Average Product is falling
  3. When the Average product is maximum, marginal product equals Average Product and the total product is rising
  4. When Marginal Product is at maximum, Average Product equals Marginal Product and the total product is rising

Answer: 4. When Marginal Product is at maximum, Average Product equals Marginal Product and total product is rising

The marginal, average and total product curves encountered by the firm producing in the short run exhibit all of the following relationships except when marginal product is at maximum, average product equals marginal product and total product is rising.

Question 141. Marginal cost can be directly derived from 

  1. Total variable cost
  2. Total fixed cost.
  3. Average cost
  4. Average fixed cost

Answer: 2. Total fixed cost.

It is derived from the variable cost of production, given that fixed costs do not change as output changes, hence, no additional fixed cost is incurred in producing another unit of a good or service once production has already started.

Question 142. Total economic cost = implicit cost + explicit cost +

  1. Normal Profit
  2. Abnormal Profit
  3. Economic Profit
  4. None of the above

Answer: 1. Normal Profit

Total economic cost

  1. Implicit Cost +
  2. Explicit Cost  +
  3. Normal Cost.

Question 143. The marginal product of a variable input is described as?

  1. The additional output resulting from one unit increase in both the variable and fixed inputs
  2. The additional output resulting from one unit increase in fixed input
  3. The additional output resulting from one unit increase in the variable inputs
  4. The additional output resulting from all unit increases in variable inputs

Answer:  3. The additional output resulting from one unit increase in the variable inputs

The marginal cost is the cost of producing one extra unit of output, in the short run, the fixed cost does not change by producing one ‘ extra unit, thus the marginal cost is entirely comprised of the variable cost.

Question 144. Total profits are maximized when?

  1. TR equal TC
  2. The TR curve and the TC curve are parallel
  3. TC exceeds TR
  4. TR exceeds TC

Answer: 4. TR exceeds TC

The profits are maximized where the gap between the total revenue and the total cost curves is the maximum. This happens only when both the curves are parallel to each other. The profits will be positive only when the total revenues exceed the total cost.

Question 145. A firm producing 7 units of output has an average total cost of 7 150 and has to pay 7 350 to its fixed factors of production whether it produces or not. How much of the average total cost is made up of variable costs?

  1. ₹ 100
  2. ₹ 200
  3. ₹ 50
  4. ₹ 300

Answer: 1. 100

Number of units = 7

ATC = ₹150

TFC = ₹ 350

AVC = ATC- AFC

= 150-50

= ₹ 100

Question 146. Economic costs include

  1. Implicit costs
  2. Explicit costs
  3. Implicit and explicit costs
  4. None of the above

Answer: 3. Implicit and explicit costs

Economic costs include both Explicit and implicit costs. Therefore, economic costs are useful for businessmen while making decisions.

Question 147. At the shut-down point, the price is

  1. Below ATC
  2. Below AVC
  3. Equal to ATC
  4. Above AVC

Answer:  2. Below AVC

The firm always has the option of not producing at all. If a firm’s total revenues are not enough to make goods even the total variable cost. The firm should shut down. In other words, a competitive firm should shut down if the price is below AVC

Question 148. Economic cost includes which of the following?

  1. Accounting cost
  2. Implicit cost
  3. Both (1) and (2)
  4. None of the above

Answer: 3. None of the above

Both (1) and (2)

Economic cost includes both accounting cost (actual payment) and implicit cost (notional expense).

Question 149. External economies are due to

  1. Development of skilled labor
  2. Technologies
  3. Cheaper raw material
  4. All of the above

Answer: 4. All of the above

External Economies are due to the development of skilled labour, technology, cheaper raw materials, etc.

Question 150. The planning curve is related to

  1. Long-run average cost curves
  2. Short-run average cost curves
  3. Average revenue curve
  4. None of the above

Answer: 1. Long-run average cost curves

Long Run Average Cost Curve:

Long Run Average Cost Curve is after called a planning curve because a firm plans to produce any output in the long run by choosing a plant on the long-run average cost curve.